Spring Index
Last updated: 2025
Latest data available: 2024
Introduction
This indicator highlights a biological response to climate change and a potential pressure on biological systems. It shows the impact of temperature change on the timing of biological events such as flowering or migration in the spring. The Spring Index is calculated from the annual mean observation date of the following four biological events: first flowering of hawthorn (Crataegus monogyna), first flowering of horse chestnut (Aesculus hippocastanum), first recorded flight of an orange-tip butterfly (Anthocharis cardamines), and first sighting of a swallow (Hirundo rustica).
Data for this indicator can be found in the published datafile. We also have a similar indicator at the England level.
Type of indicator
Pressure indicator
Type of official statistics
Official statistic
Contents
- Assessment of change
- Key results
-
Further detail
- Figure 3: Timing of UK Biological Events (Days After 31 December): Hawthorn and Horse Chestnut Flowering, Orange Tip Butterfly Emergence, and Swallow Arrival, and Their Correlation with Central England Temperature, 1999 to 2024
- Relevance
- International/domestic reporting
- Web links for further information
- Acknowledgements
- Technical Annex
Assessment of change
We are working with the Woodland Trust and hope to publish an assessment of change for this indicator in 2026, see the Development Plan for more information.
Key results
The Spring Index for the UK has high year-to-year variability, but since 1998 the annual mean observation dates have been 8.7 days in advance of the average dates in the first part of the 20th century (Figure 1).
The advancement of spring events is strongly linked to warmer temperatures in March and April. The mean observation dates in 2011 are the earliest for which there are records and coincides with the warmest April in the Central England Temperature series, resulting in an especially early spring that year.
Figure 1: Index of the timing of biological spring events (number of days after 31 December) in the UK, 1891 to 1947, and 1998 to 2024
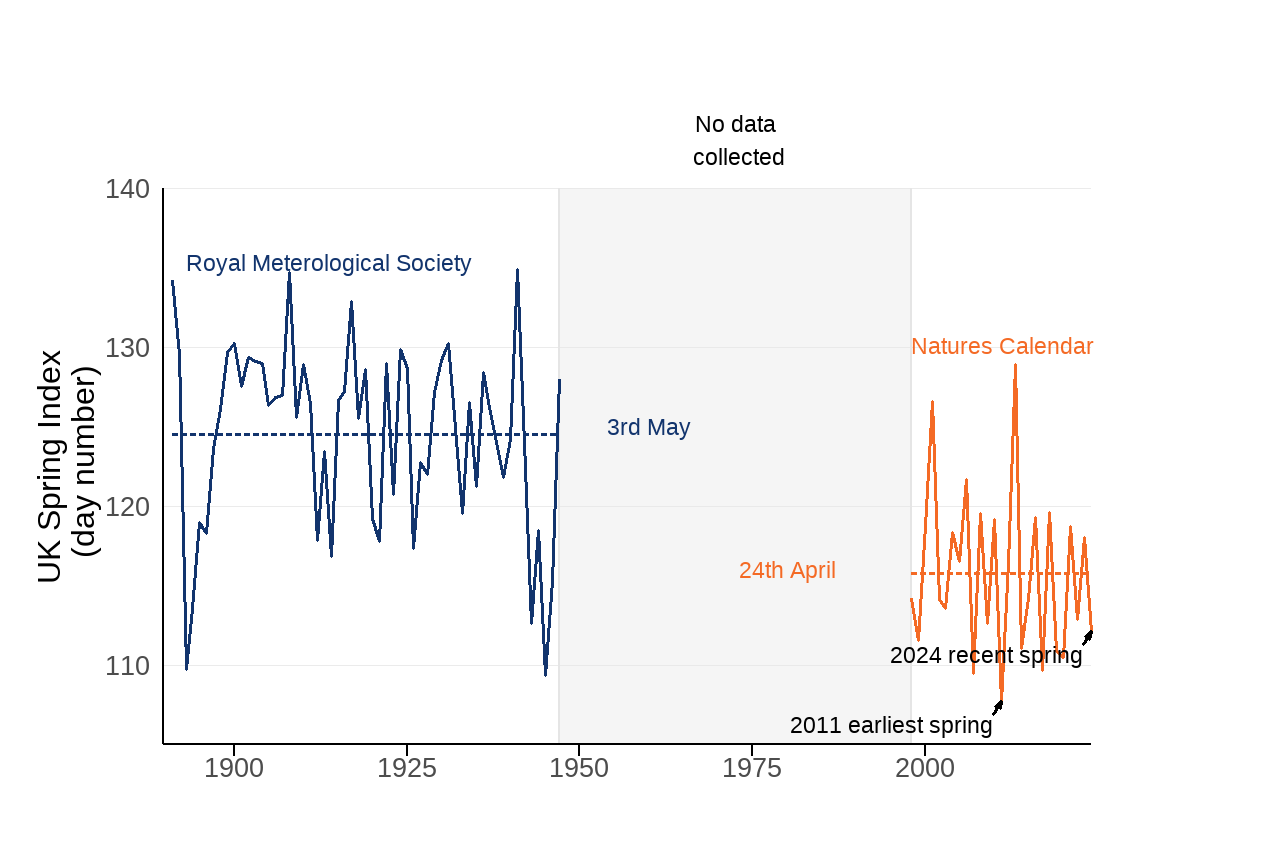
Source: 1891 to 1947 – Royal Meteorological Society, 1998 to 2024 – UK Phenology Network (Nature’s Calendar, currently funded by the People’s Postcode Lottery, Postcode Green Trust)
Notes about Figure 1
- Index denotes number of days after 31 December (for example, day 122 = 1 May).
- The dark blue and orange dashed lines represent the average day for the Royal Meteorological data and the average day for Nature’s Calendar data respectively.
The Index shows a strong relationship with mean temperature in March and April, and it advances more rapidly when the mean temperature equals or exceeds seven degrees Celsius (Figure 2).
The average advance in dates for the Spring Index is 3.6 days for every one degree increase in Celsius when the mean March to April temperature is below 7 degrees Celsius, and 7.2 days for every one degree increase in Celsius when the mean March to April temperature is equal to or above 7 degrees Celsius.
Figure 2: Relationship between Spring Index and Central England Temperature (CET), 1891 to 1947, and 1998 to 2024
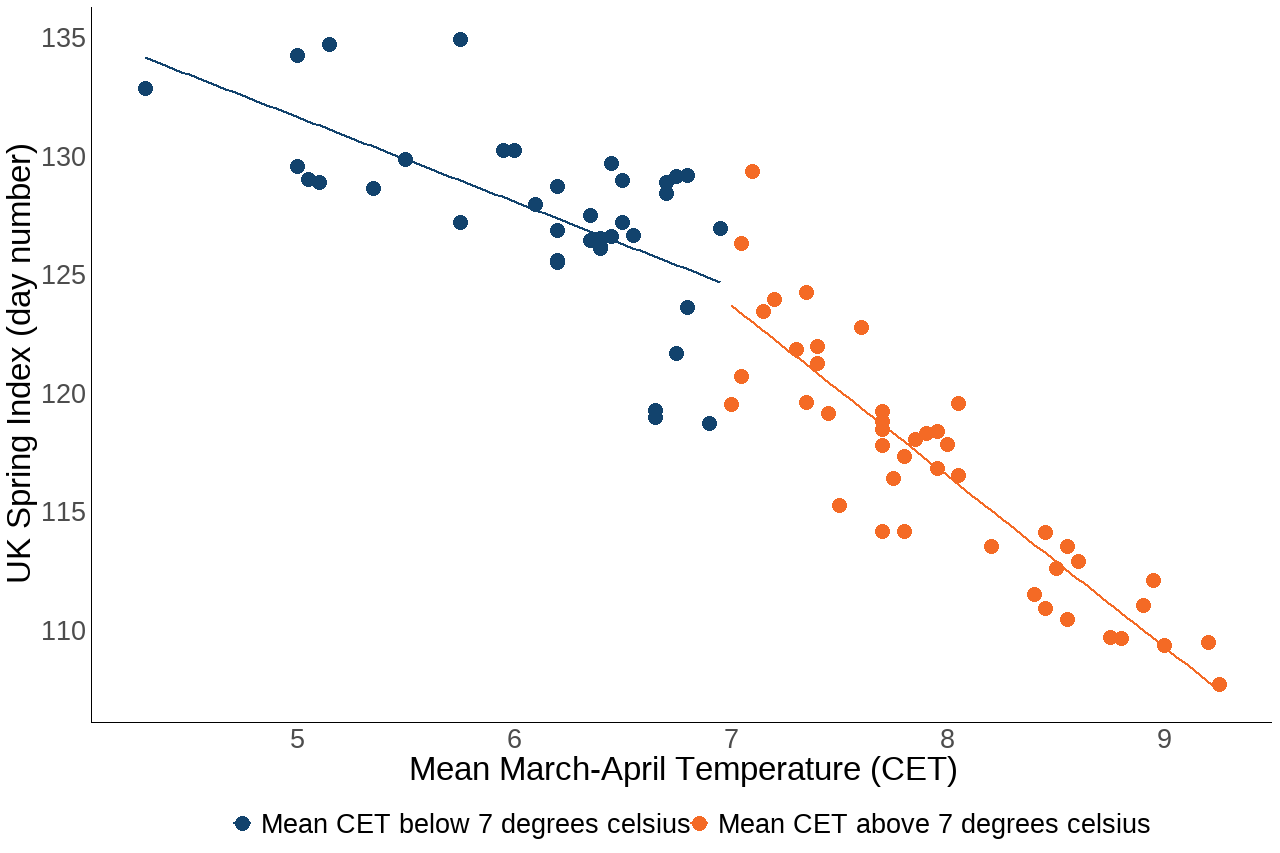
Source: 1891 to 1947 – Royal Meteorological Society, 1998 to 2024 – UK Phenology Network (Nature’s Calendar)
Notes about Figure 2
- Index denotes number of days after 31 December (for example, day 122 = 1 May).
- CET = Central England Temperature series, in degrees Celsius.
Further detail
The UK Spring Index is the combination of four individual biological events, the trend in these events over time and their relationship with the Central England Temperature is shown in Figure 3. The charts show a strong relationship with spring temperature for three of the four events. However, the data for the swallow does not appear to respond to temperature changes in the same way, diverging from the pattern observed in the overall Spring Index.
Figure 3: Timing of UK Biological Events (Days After 31 December): Hawthorn and Horse Chestnut Flowering, Orange Tip Butterfly Emergence, and Swallow Arrival, and Their Correlation with Central England Temperature, 1999 to 2024
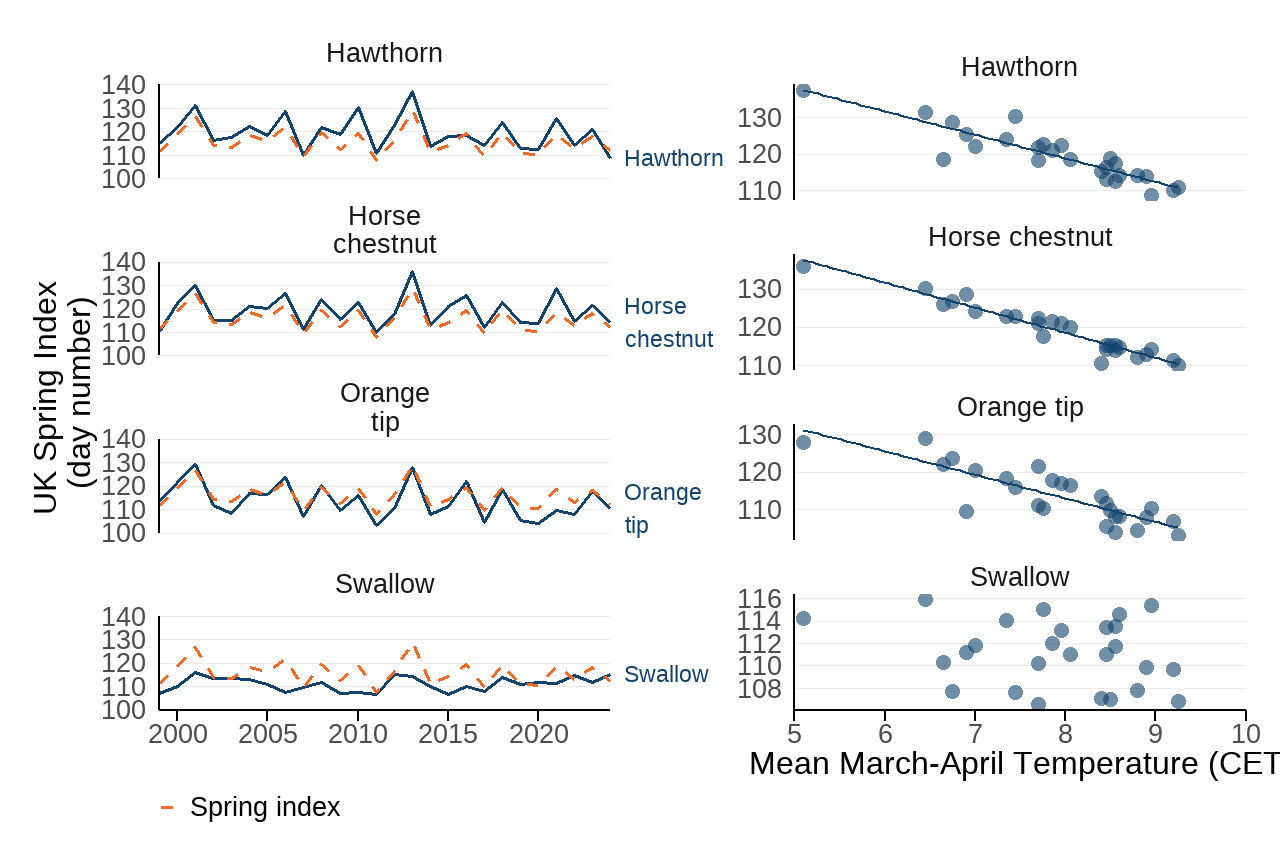
Source: 1999 to 2024 – UK Phenology Network (Nature’s Calendar, currently funded by the People’s Postcode Lottery, Postcode Green Trust)
Notes about Figure 3
- Index denotes number of days after 31 December (for example, day 122 = 1 May).
- Four biological events are shown; first flowering of hawthorn (Crataegus monogyna), first flowering of horse chestnut (Aesculus hippocastanum), first recorded flight of an orange-tip butterfly (Anthocharis cardamines), and first sighting of a swallow (Hirundo rustica).
- Dashed orange lines represent the Spring Index.
For further information on the methods used in this indicator, please see the Technical Annex below.
Relevance
Phenology is the study of the timing of recurring natural events in relation to climate, and such observations provide year-on-year information on how nature is responding to a changing climate. This indicator illustrates the stress that one aspect of climate change (spring warming) can place on biological systems. Differential responses among species may cause problems for life cycles (e.g. pollinating insects emerging out of synchrony with flowers opening in spring), increasing vulnerability to extreme events such as late frosts, disruption of food webs, and changing the balance of competition between species.
International/domestic reporting
The suite of UK Biodiversity Indicators has been revised and updated to bring it in line with the Kunming-Montreal Global Biodiversity Framework (GBF) of the Convention on Biological Diversity (CBD). Some UKBIs will be used for the forthcoming UK national reports to CBD.
Web links for further information
- Royal Meteorological Society website on the State of the UK Climate 2023
- IPCC website on the IPCC Sixth Assessment Report
- NASA’s website on NASA Global Climate Change
- World Meteorological Organization website on WMO State of the Global Climate 2023
- Bulletin of the American Meteorological Society on BAMS State of the Climate In 2023
- The Woodland Trust website
- Nature’s Calendar
- The UK Innovation and Research Forum website on Research & Innovation for our Dynamic Environment (RIDE) forum
- Living with environmental change website on Biodiversity Climate Change Impacts Report Card 2015
- Marine Climate Change Impacts Partnership website on Marine Climate Change Impacts Report Card 2020
- Convention on Biological Diversity website on Aichi Biodiversity Targets
- Convention on Biological Diversity website on Kunming-Montreal Global Biodiversity Framework 2030 targets
- Defra’s website on Biodiversity 2020: A strategy for England’s wildlife and ecosystem services
Acknowledgements
Thank you to the many people who have contributed by providing data and to the many colleagues who have helped produce this indicator. In particular, thanks go to all those citizen scientists contributing their data to Nature’s Calendar and to the Woodland Trust.
Technical Annex
Methodology
The UK Spring Index is calculated from the annual mean observation date of the following four biological events: first flowering of hawthorn (Crataegus monogyna), first flowering of horse chestnut (Aesculus hippocastanum), first appearance of orange tip butterfly (Anthocharis cardamines) and first sighting of a swallow (Hirundo rustica).
These four events were chosen for the following reasons:
- good UK coverage
- well recognised and easily recorded species
- good historical data
- both early and later spring events are included
- the observations cover plants, a vertebrate, and an invertebrate
- a strong phenological response is observed
The overall index is compiled by calculating an annual mean for each species using all available data, and averaging these four means.
The number of locations will vary from year to year. The UK Spring Index varies year to year mostly because of differences in the temperature.
The average date of these events is now (1998 to 2024) about 8.7 days in advance of the average for the period 1891 to 1947. The UK Spring Index shows a very significant relationship with mean March-April Central England Temperature, which appears to be stronger when mean temperatures exceed 7⁰C. For the UK Spring Index, the relationship in years with mean March-April temperatures below 7⁰C was:
UK Spring Index = 149.53 - 3.57 x Temperature, R2 = 38.83%, p<0.001
The equivalent for years when mean March to April temperatures equalled or exceeded 7⁰C was:
UK Spring Index = 174.25 - 7.22 x Temperature, R2 = 80.66%, p<0.001
Data for the 1891 to 1947 period comes from the phenological network of the Royal Meteorological Society as published in the Quarterly Journal of the Royal Meteorological Society. This was a voluntary network of recorders that submitted their phenological observations to a central coordinator. All these data have now been digitised and loaded into the Nature’s Calendar database. The UK Phenology Network/Nature’s Calendar project runs along broadly similar lines. As a citizen science project, it also involves volunteers contributing their observations. It is run and coordinated by the Woodland Trust and funded by the People’s Postcode Lottery, Postcode Green Trust. Here we use their data from 1998 onwards. The number of records varies from year to year, but the current scheme is substantially bigger than the earlier one.
Since locations reflect the distribution of volunteer recorders they are not evenly spread across the UK, but rather reflect the density of human population, with a greater number of recorders in the South-East and fewer in the North.
The reliability of the data is dependent on the frequent and timely observations of the natural world by the volunteer recorders. The data show such a strong relationship with temperature that we have confidence in their reliability.
Development plan
We are working with Woodland trust to assess the suitability of including Swallow in the spring index, seeking to substitute it for a species which is more affected by the spring temperatures in the UK.
We are also working with Woodland Trust to develop a suitable method for assessing change in the indicator, and hope to publish an assessment of change when the indicator is next updated in 2026.
If you would like to contribute to these developments please email us.
Categories:
Published: