Red List of Ecosystems
Last updated: 2025
Latest data available: 2025
Introduction
This indicator measures the average risk of ecosystem collapse across natural and semi-natural ecosystems in the UK. It is based on Red List Ecosystem (RLE) assessments to assess the risk of collapse of individual ecosystems, carried out at UK level. Healthy ecosystems are crucial for supporting species populations and provide many services which society relies on. Assessments are made for ecosystems classified at Global Ecosystem Typology level 3 (also known as Ecosystem Functional Groups) using IUCN criteria. As repeat assessments are carried out in the future, this indicator will track change in the average risk over time based on genuine change in the risk category of each ecosystem.
RLE assessments are being carried out in a phased approach. This current iteration of the indicator is based on almost half of the natural and semi-natural ecosystem types found in the UK. The complete set of ecosystems will be assessed in future years. The ecosystems included in this first iteration have been prioritised largely on the basis of pragmatism, in particular, the availability of specialist staff to undertake assessments and a desire to cover a range of different ecosystem types.
This indicator ‘A1 Red List of Ecosystems’ is a headline indicator that has been published as part of the UK’s response to the Convention on Biological Diversity’s Kunming-Montreal Global Biodiversity Framework (GBF). It relates to GBF Goal A and Target 1.
Data for this indicator can be found in the published datafile.
Type of indicator
State indicator
Type of official statistics
Official statistic in development. This indicator is classified as an official statistic in development because it is currently based on an incomplete set of RLE assessments. For more information, please visit the UK Statistics Authority’s website on types of official statistics.
Assessment of change
There are currently insufficient data points available for this indicator to carry out an assessment of change.
Key results
The overall indicator value in 2025, based on the subset of ecosystem types currently assessed, is 0.54. A score of 0 indicates that all ecosystems included have collapsed. A score of 1 indicates that all ecosystems included are classified as being of least concern.
The summary breakdown of Red List Ecosystem assessment results so far is presented in Table 1. The full range of ecosystem types listed in Table 2 will be assessed and incorporated into the indicator value in the future.
Table 1. Summary breakdown of Red List Ecosystem assessment results
| Threat category | Total ecosystems within category |
|---|---|
| Ecosystems assessed as Critically Endangered | 2 |
| Ecosystems assessed as Endangered | 7 |
| Ecosystems assessed as Vulnerable | 8 |
| Ecosystems assessed as Near Threatened | 1 |
| Ecosystems assessed as Least Concern | 2 |
| Ecosystems not assessed | 28 |
Source: JNCC and NatureScot
Further detail
RLE assessments were carried out by specialists in NatureScot and JNCC in 2025. Each ecosystem assessment draws on published data and research to evaluate the current status and likely trends over the next 50 years. The RLE assessment results for individual ecosystems are presented in Table 2. Details on the assessment approach and the calculation of the overall indicator value can be found in the technical annex. Full assessments are available on JNCC’s data hub.
Table 2. Individual results for RLE assessments
| Ecosystem | Assessment Result |
|---|---|
| F1.1 Permanent upland streams | Endangered |
| F2.2 Small permanent freshwater lakes | Endangered |
| FM1.2 Permanently open riverine estuaries and bays | Vulnerable |
| FM1.3 Intermittently closed and open lakes and lagoons | Vulnerable |
| M1.1 Seagrass beds | Critically Endangered |
| M1.10 Rhodolith/ Maërl beds | Vulnerable |
| M1.4 Shellfish beds and reef | Vulnerable |
| M1.6 Subtidal Rocky Reefs | Vulnerable |
| M1.7 Subtidal sand beds | Near Threatened |
| M1.8 Subtidal mud plains | Vulnerable |
| M2.1 Epipelagic ocean waters | Vulnerable |
| M3.5 Deep water biogenic beds | Critically Endangered |
| MT1.1 Rocky shorelines | Least Concern |
| MT2.1 Machair | Endangered |
| SM1.3 Sea caves | Least Concern |
| T2.1 Boreal and temperate high montane forests and woodland | Vulnerable |
| T2.3 Oceanic cool temperate rainforest | Endangered |
| T3.3 Cool temperate heathlands | Endangered |
| T6.4 Temperate alpine grasslands and shrublands | Endangered |
| TF1.6 Boreal, temperate and montane peat bogs | Endangered |
| F1.2 Permanent lowland rivers | Not assessed |
| F2.1 Large permanent freshwater lakes | Not assessed |
| F2.3 Seasonal freshwater lakes | Not assessed |
| F2.4 Freeze-thaw freshwater lakes | Not assessed |
| FM1.1 Deepwater coastal inlets | Not assessed |
| M1.2 Kelp forests | Not assessed |
| M1.5 Photo-limited marine forests | Not assessed |
| M2.2 Mesopelagic ocean water | Not assessed |
| M2.3 Bathypelagic ocean waters | Not assessed |
| M2.4 Abyssopelagic ocean waters | Not assessed |
| M3.1 Continental and island slopes | Not assessed |
| M3.2 Submarine canyons | Not assessed |
| M3.3 Abyssal Plains | Not assessed |
| M3.4 Seamounts, ridges and plateaus | Not assessed |
| MFT1.3 Coastal saltmarshes and reedbeds | Not assessed |
| MT1.2 Muddy shorelines | Not assessed |
| MT1.3 Sandy shorelines | Not assessed |
| MT1.4 Boulder and cobble shores | Not assessed |
| MT2.2 Large seabird and pinniped colonies | Not assessed |
| S1.1 Aerobic caves | Not assessed |
| S1.2 Endolithic systems | Not assessed |
| SF1.1 Underground streams and pools | Not assessed |
| SF1.2 Groundwater ecosystems | Not assessed |
| T2.2 Deciduous temperate forests | Not assessed |
| T3.4 Young rocky pavements, lava flows and screes | Not assessed |
| T7.5 Derived semi-natural pastures and old fields | Not assessed |
| TF1.2 Subtropical/temperate forested wetlands | Not assessed |
| TF1.7 Boreal and temperate fens | Not assessed |
Source: JNCC and NatureScot
Notes about Table 2
- Assessments have been carried out at UK level.
- Assessments are for ecosystems classified at Global Ecosystem Typology level 3 (also known as Ecosystem Functional Groups) using IUCN criteria.
- The assessment for MT2.1 Coastal shrublands and grasslands, was restricted to Machair, a habitat which fits under this ecosystem type.
Relevance
Resilient ecosystems are crucial for preventing biodiversity loss and species extinction. Maintaining healthy ecosystems safeguards the essential services they provide, which are fundamental to human well-being and a thriving economy.
The indicator presents the level of threat facing ecosystems in the UK and enables comparison of different ecosystems. At a practical level, the creation of RLE assessments could influence prioritisation for conservation funding and where to take conservation management action on the ground.
International/domestic reporting
The suite of UK Biodiversity Indicators has been revised and updated to bring it in line with the Kunming-Montreal Global Biodiversity Framework of the Convention on Biological Diversity (CBD). Some UKBIs, including this headline indicator, will be used for the forthcoming UK national reports to CBD.
This indicator links to GBF Goal A ‘Protect and Restore’ and Target 1 ‘Plan and Manage all Areas to Reduce Biodiversity Loss’.
Web links for further information
Acknowledgements
Thank you to the many colleagues throughout the country nature conservation bodies (particularly in NatureScot) and JNCC who have contributed to the development of this indicator and the RLE assessments and data that feed into it, in particular David O’Brien and Eunice Pinn in NatureScot and Ed Mountford at the JNCC.
Technical annex
Methodology
RLE assessments were carried out following IUCN criteria and guidance. The following aspects were considered: change in geographic distribution through time; whether the ecosystem distribution is geographically restricted; evidence for any environmental degradation; and disruption to biotic processes or interactions. The IUCN methodology is widely used as a robust approach to assessing the status of ecosystems.
The overall RLE indicator value was calculated using the formula set out in the GBF indicator metadata:
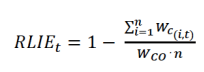
where Wc(i,t) is the risk category rank for ecosystem i in year t (Collapsed = 5, Critically Endangered = 4, Endangered = 3, Vulnerable = 2, Near Threatened = 1, Least Concern = 0), WCO is the maximum category rank (CO = Collapsed = 5), and n is the total number of ecosystems excluding Data Deficient or Not Evaluated ecosystems. The RLIe ranges from 0 (all ecosystems Collapsed) to 1 (all Least Concern).
The assessments that feed into this indicator are conducted at UK scale. Using an internationally agreed formula to present the overall UK indicator value will allow for comparability of the overall threat status of UK ecosystems compared with other countries once the full range of ecosystem assessments is completed.
The ecosystem types to be included in this indicator will include all Ecosystem Functional Groups (Global Ecosystem Typology level 3) found in the UK with sufficient data to enable assessment, with the exclusion of anthropogenic ecosystems. See Table 2 for a full list of ecosystems found in the UK. We note that this includes additional habitats to those which have been able to be reported under the UK Biodiversity Indicator ‘Extent of Natural Ecosystems’.
Caveats and limitations
The indicator is currently an ‘Official Statistic in Development’. It is currently based on a limited range of ecosystems for which assessments have been completed. This was not a random sample, and the overall indicator value for this first iteration of the indicator is unlikely to accurately reflect the overall threat status of ecosystems in the UK.
Development plan
This is a new indicator. We plan to further develop the indicator by including RLE assessments for the full range of natural and semi-natural ecosystems found within the UK. These assessments are planned for the coming years, and those that have already been completed will undergo further review and revision where necessary.
We are keen to hear from our users about these intended changes, the language and visualisations used in this indicator, as well as our published development plan for the biodiversity indicators: please email us.
Categories:
Published: