Extent and condition of Protected Areas
Last updated: 2025
Latest data available: 2025
Introduction
The UK has committed to protect 30% of land and sea for nature by 2030. This commitment is in support of the global 30by30 target (Target 3) of the Kunming-Montreal Global Biodiversity Framework (GBF) which aims to conserve at least 30% of terrestrial and inland water, and 30% of marine and coastal areas by 2030.
The first part of this indicator (Part A) will show the extent of land in the UK which is protected or conserved for biodiversity and effectively managed and draws on data presented in the following parts of the indicator. Data presented here reflect the UK’s contribution to this target. No data are yet available from the four countries of the UK, future publications of this indicator will be updated to include data as it becomes available.
The second part of this indicator (Part B) shows the extent of formally protected areas in the UK, on land and at sea. Designation and management of these areas is a key mechanism for conserving wildlife and taking action to reverse the loss of biodiversity. Protected areas cover many of the most valuable sites for biodiversity in the UK with associated legal mechanisms for safeguarding habitats and species.
The third part of this indicator (Part C) recognises Other effective area-based conservation measures (OECMs), land outside of protected areas that are managed effectively for the conservation of biodiversity. These sites contribute to the UK’s 30by30 target. Currently data are only available for Scotland, but future publications of this indicator will be updated to include more data as it becomes available.
The fourth part of this indicator (Part D) reflects the effectiveness of conservation management on formally protected land. Currently the only data available is the condition status of features within Areas/Sites of Special Scientific Interest (A/SSSI). Features are the species or habitats for which the sites have been designated.
The data for this indicator can be downloaded from JNCC’s Resource Hub. We also have a similar indicator at the England level.
Type of indicator
Part A: Land which is protected or conserved and effectively managed - State indicator
Part B: Extent of formally protected areas - State indicator
Part C: Land outside of formally protected areas that conserves biodiversity (OECMs) - State indicator
Part D: Land which is effectively managed for biodiversity - State indicator
Type of official statistic
Official statistic in development - part A and C: The UK biodiversity indicators project team would welcome feedback on the novel methods used in the development of this indicator. For more information, please visit the UK Statistics Authority’s website on Types of official statistics – UK Statistics Authority. To provide feedback, email the production team at Biodiversity@defra.gov.uk.
Official Statistic - parts B and D
Contents
- Assessment of change
-
Key results
- Part A) Land which is protected or conserved and effectively managed for biodiversity
- Part B) Extent of formally protected areas
- Figure 1: Total area of formally protected sites: on land and at sea, 1950 to 2025
- Part C) Land outside of formally protected areas that conserves biodiversity (OECMs)
- Part D) Land which is effectively managed for biodiversity
- Figure 2: Cumulative proportion of Areas of Special Scientific Interest (Northern Ireland) and Sites of Special Scientific Interest Scotland, (Wales (from 2022) and England (from 2024)) in ‘favourable’ or ‘unfavourable-recovering’ condition, 2005 to 2025
-
Further detail
- Landscape Designations
- Figure 3: Extent of Landscape Designations, 1950 to 2025
- Condition of Special Areas of Conservation and Special Protection Areas
- Figure 4: Cumulative proportion of Special Areas of Conservation (SAC) in ‘favourable’ or ‘unfavourable-recovering’ condition, 2005 to 2025
- Figure 5: Cumulative proportion of Special Protection Areas (SPA) in ‘favourable’ or ‘unfavourable-recovering’ condition, 2005 to 2025
- Relevance
- International/domestic reporting
- Web links for further information
- Acknowledgements
-
Technical annex
- Methodology
- Method for calculating area protected or conserved and effectively managed, on land and at sea
- Method for calculating the total extent of formally protected areas, on land and at sea
- Method for calculating land outside of formally protected areas that conserves biodiversity (OECMs)
- Method for calculating land which is effectively managed
- Background
- Extent
- Figure 6: Map of UK terrestrial and marine protected areas, as at 31 March 2025
- Condition
- Development plan
Assessment of change
Assessment of change in extent and condition of UK protected areas.
| Measure | Assessment | Time period | Result |
|---|---|---|---|
| Part B: Total extent of protected areas:on land | Long term | 1950 to 2025 | Improving |
| Part B: Total extent of protected areas:on land | Short term | 2020 to 2025 | Little or no overall change |
| Part B: Total extent of protected areas:at sea | Long term | 1950 to 2025 | Improving |
| Part B: Total extent of protected areas:at sea | Short term | 2020 to 2025 | Little or no overall change |
| Part D: Condition of A/SSSIs | Long term | 2005 to 2025 | Insufficient or no comparable data |
| Part D: Condition of A/SSSIs | Short term | 2020 to 2025 | Insufficient or no comparable data |
Notes on the indicator assessment
- Long- and short-term assessments are based on a 3% rule of thumb. Where possible, the base years for these assessments use a three-year average. See Assessing Indicators.
- Natural England have provided SSSI condition data based on the number of features since 2024. Historical data for Natural England is based on area assessments. Assessments of change have not been reported for A/SSSI condition as historical data is not comparable.
- Parts A and C have not been assessed as there are currently insufficient data points to carry out any assessments.
Key results
Part A) Land which is protected or conserved and effectively managed for biodiversity
Part A of the indicator draws together the following sections, and includes land from formally protected areas (part B) and land outside of formally protected areas (OECMs) (part C), which is appropriately managed for biodiversity (part D).
At present, England has developed criteria for its 30by30 on land commitment, outlined in 30by30 on land in England: confirmed criteria and next steps. Data are not yet available for England and will be added once assessments are complete.
Progress on Scotland’s 30by30 criteria development is available in the Framework for 30by30 in Scotland. The Welsh Government published A 30by30 framework for Wales in 2025 and alongside Scotland, are currently assessing results under these frameworks. The data from these assessments will be added to this indicator once they become available. Northern Ireland are currently in the process of developing a delivery plan that will define criteria for assessing whether areas meet the requirements for inclusion in the 30by30 target.
Part B) Extent of formally protected areas
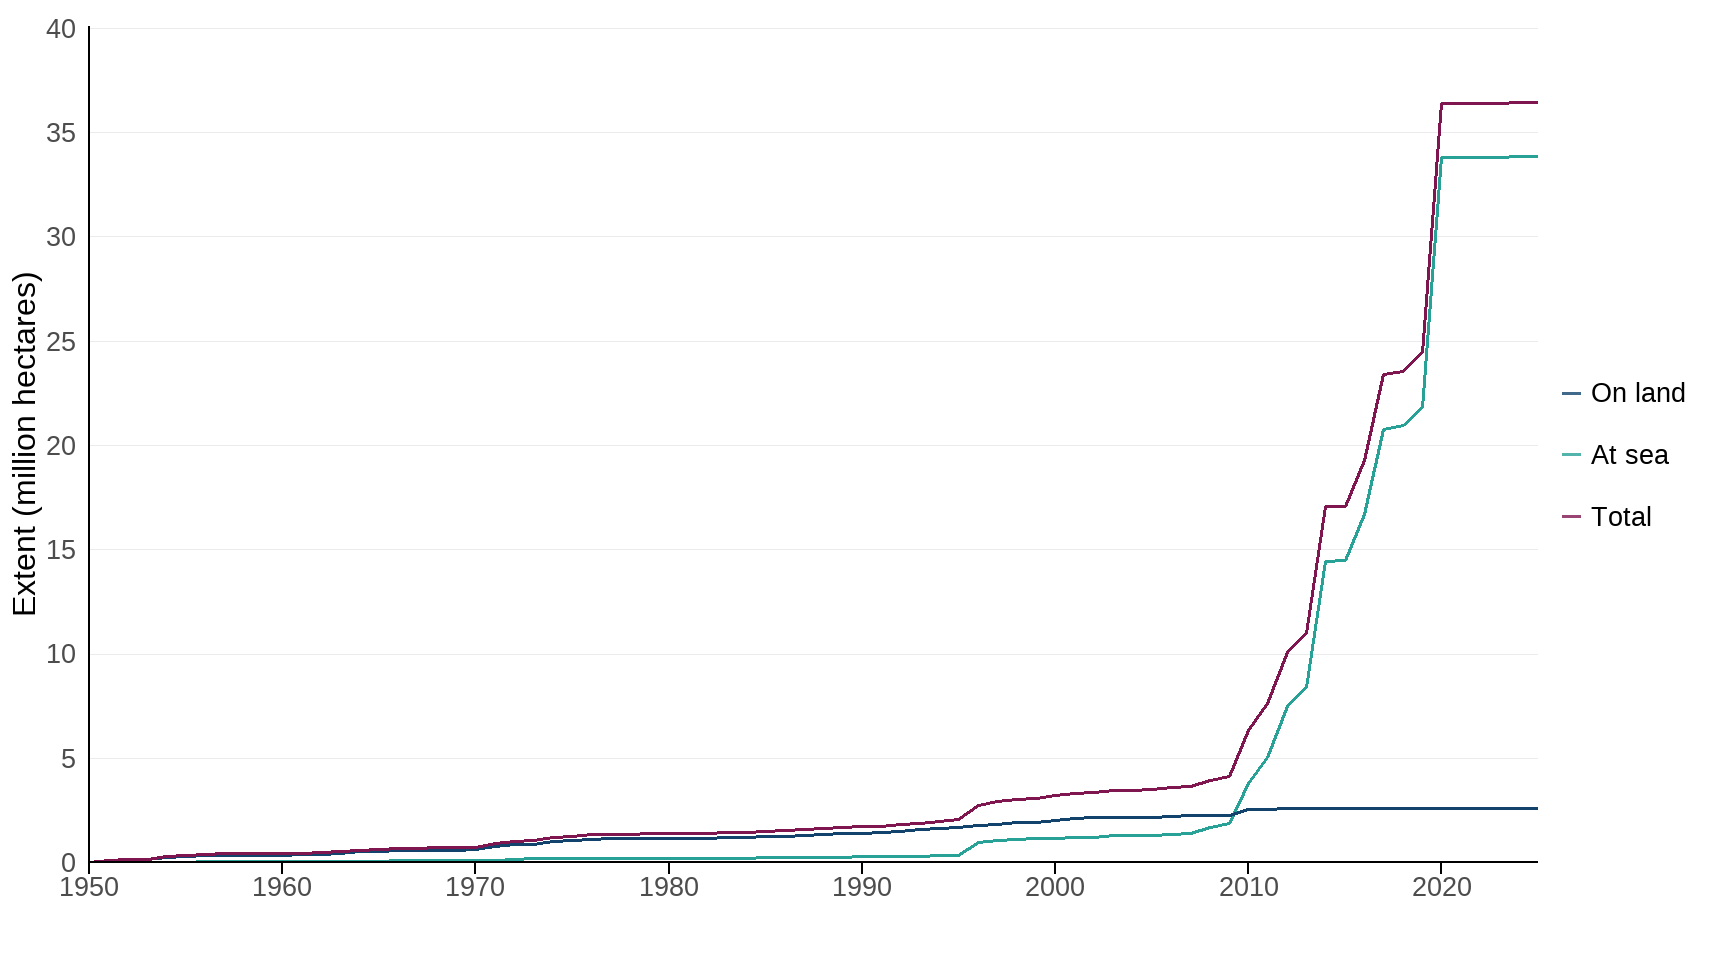
The total extent of land and sea protected in the UK through national and international protected areas designations has remained unchanged at 36 million hectares (MHa) between December 2020 and 31 March 2025 (Figure 1).
Previously, this part of the indicator included National Landscapes (formerly Areas of Outstanding Natural Beauty in England and Wales), National Parks, National Scenic Areas, and Areas of Outstanding Natural Beauty (still a designation in Northern Ireland). These designations are now presented separately in Figure 3.
As of 31 March 2025, 2.60 MHa of land and freshwater have been designated under national and international legislation, representing 10.6% of the UK on land. A further 33.8 MHa of UK seas, both within the 12 nautical mile limit and offshore, have also been designated, representing 38.2% of UK waters (based on the UK Continental Shelf limit) (Figure 1, Table 1).
Figure 1: Total area of formally protected sites: on land and at sea, 1950 to 2025
Source: Joint Nature Conservation Committee, Natural England, Natural Resources Wales, Northern Ireland Environment Agency, NatureScot
Notes about Figure 1
- The boundary between protected areas on land and at sea is mean high water (mean high water springs in Scotland). Coastal sites in the indicator are split between ‘on land’ and ‘at sea’ if they cross the mean high water mark. At sea extent includes offshore marine protected areas out to the limit of the UK Continental Shelf. The area of UK sea is calculated at 88.543 million hectares.
- Extent is based on the following site designations: Areas of Special Scientific Interest (Northern Ireland), Sites of Special Scientific Interest (England, Scotland and Wales), National Nature Reserves, Marine Conservation Zones, Highly Protected Marine Areas, Nature Conservation Marine Protected Areas, Ramsar Sites, Special Areas of Conservation and Special Protection Areas.
Table 1: Extent and percentage cover of protected areas by country, 2025
| Country | On land (M Ha) | On Land (%) | At sea (M Ha) | At sea (%) |
|---|---|---|---|---|
| England | 0.85 | 6.5% | 9.29 | 40.3% |
| Scotland | 1.39 | 17.6% | 22.76 | 36.9% |
| Wales | 0.23 | 10.9% | 1.55 | 50.3% |
| Northern Ireland | 0.14 | 9.8% | 0.24 | 35.6% |
| United Kingdom | 2.60 | 10.6% | 33.84 | 38.2% |
Source: Joint Nature Conservation Committee, Natural England, Natural Resources Wales, Northern Ireland Environment Agency, NatureScot
Notes about Table 1
- The boundary between protected areas on land and at sea is mean high water (mean high water springs in Scotland). Coastal sites in the indicator are split between ‘on land’ and ‘at sea’ if they cross the mean high water mark. At sea extent includes offshore marine protected areas out to the limit of the UK Continental Shelf. The area of UK sea is calculated at 88.543 million hectares.
- Extent is based on the following site designations: Areas of Special Scientific Interest (Northern Ireland), Sites of Special Scientific Interest (England, Scotland and Wales), National Nature Reserves, Marine Conservation Zones, Highly Protected Marine Areas, Nature Conservation Marine Protected Areas, Ramsar Sites, Special Areas of Conservation and Special Protection Areas.
Part C) Land outside of formally protected areas that conserves biodiversity (OECMs)
Other effective area-based conservation measures (OECMs) are geographically defined areas that are not formally designated as protected areas, but still deliver long-term, effective conservation of biodiversity. These sites enhance the national protected area network by supporting ecological connectivity, representativeness, and resilience. They promote local engagement with protecting land for biodiversity by providing formal recognition of land which has been conserved and managed to enhance biodiversity at the local level.
Frameworks for recognising OECMs are being developed in England, Wales and Northern Ireland to help meet the international 30by30 target. The data from these assessments will be added to this indicator once they become available.
Scotland has published its national approach to recognising Other effective area-based conservation measures (OECMs), known as Nature30, as part of its commitment to the global 30by30 biodiversity target. This initiative complements traditional protected areas by identifying and supporting areas that deliver long-term benefits for biodiversity through effective land or freshwater management, even if conservation is not their primary purpose. Criteria for the recognition of Nature30 sites in Scotland are available at Nature30 - The Criteria. Currently there are four sites that have been recognised in Scotland, which will form part of the UK’s contribution to the 30by30 target (see Table 2). Further detail on these sites is available at Nature 30.
Table 2: Number and coverage of OECMs recognised on land in Scotland, 2025
| Number of sites | Coverage (ha) | Percentage |
|---|---|---|
| 4 | 3730 | 0.05% |
Source: NatureScot
Notes about Table 2
- The number and coverage of OECMs recognised on land in Scotland is based on the crieria defined in 30by30 Framework and Nature30 criteria.
- Data is not currently available for England, Wales or Northern Ireland. These will be added once these data become available.
Part D) Land which is effectively managed for biodiversity
Currently robust data on the effectiveness of the UK’s protected area network are not readily available.
At present only data on the condition of Areas or Sites of Special Scientific Interest (A/SSSIs) across the UK is available.
A/SSSIs are designated on the basis of the biological features they contain, such as specific habitats or species. The condition of each feature within each site is assessed and assigned a condition score. One site can therefore have many features each in different condition.
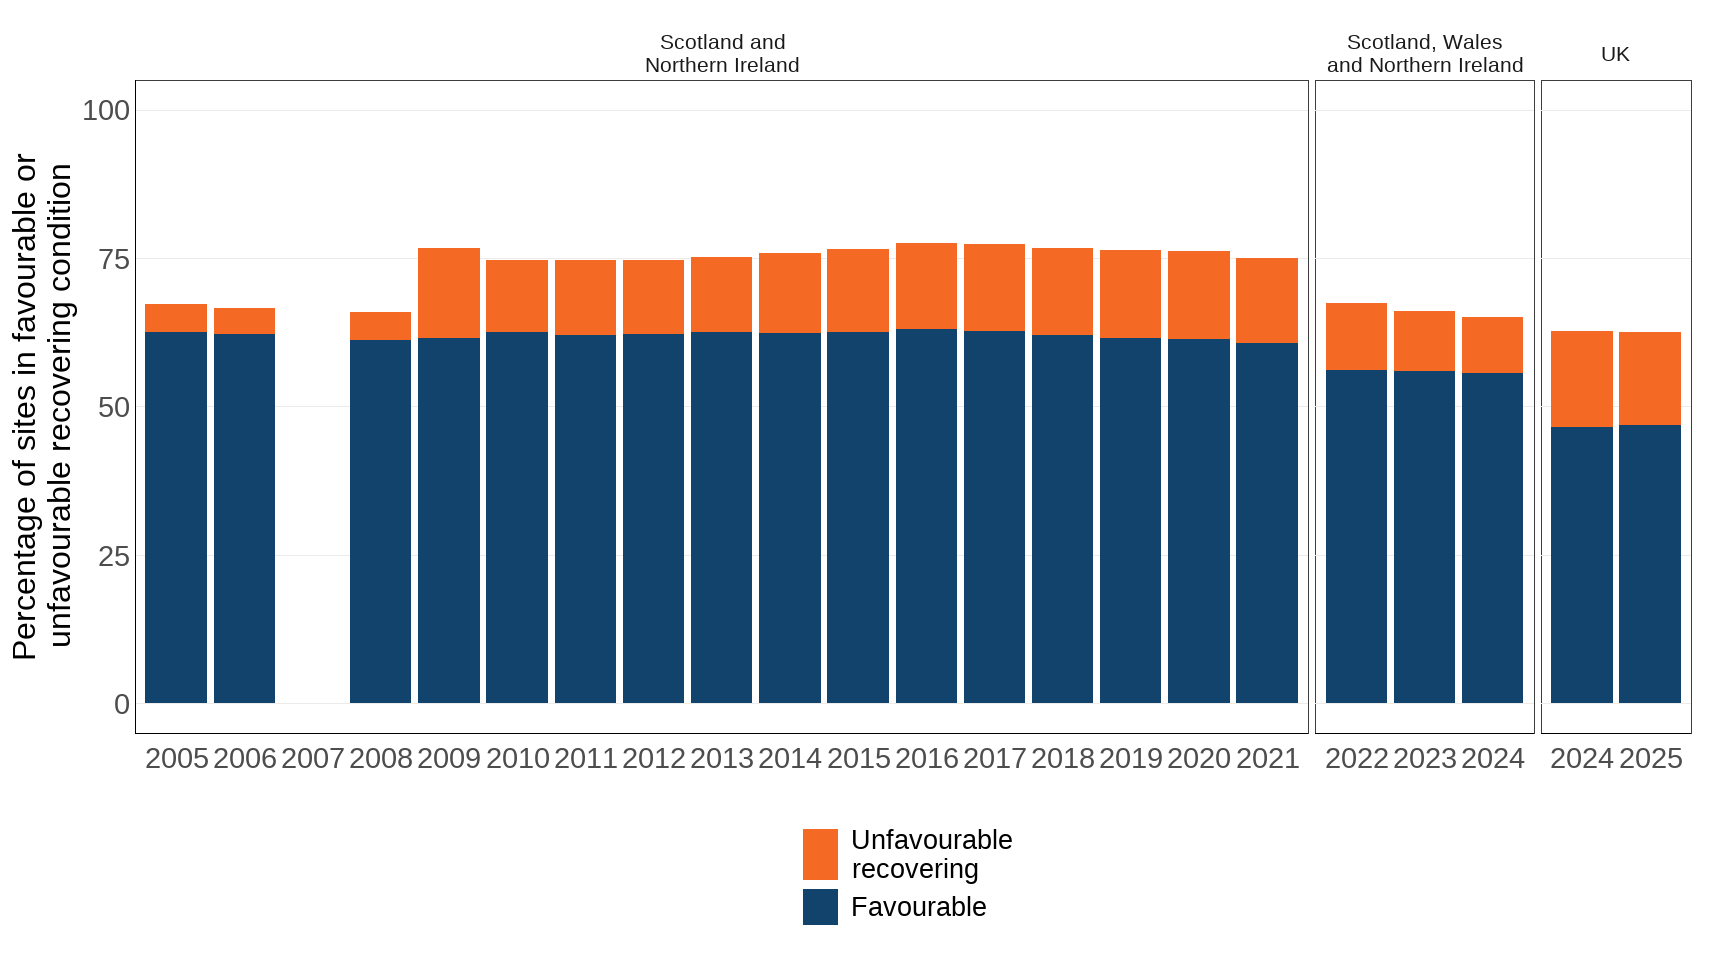
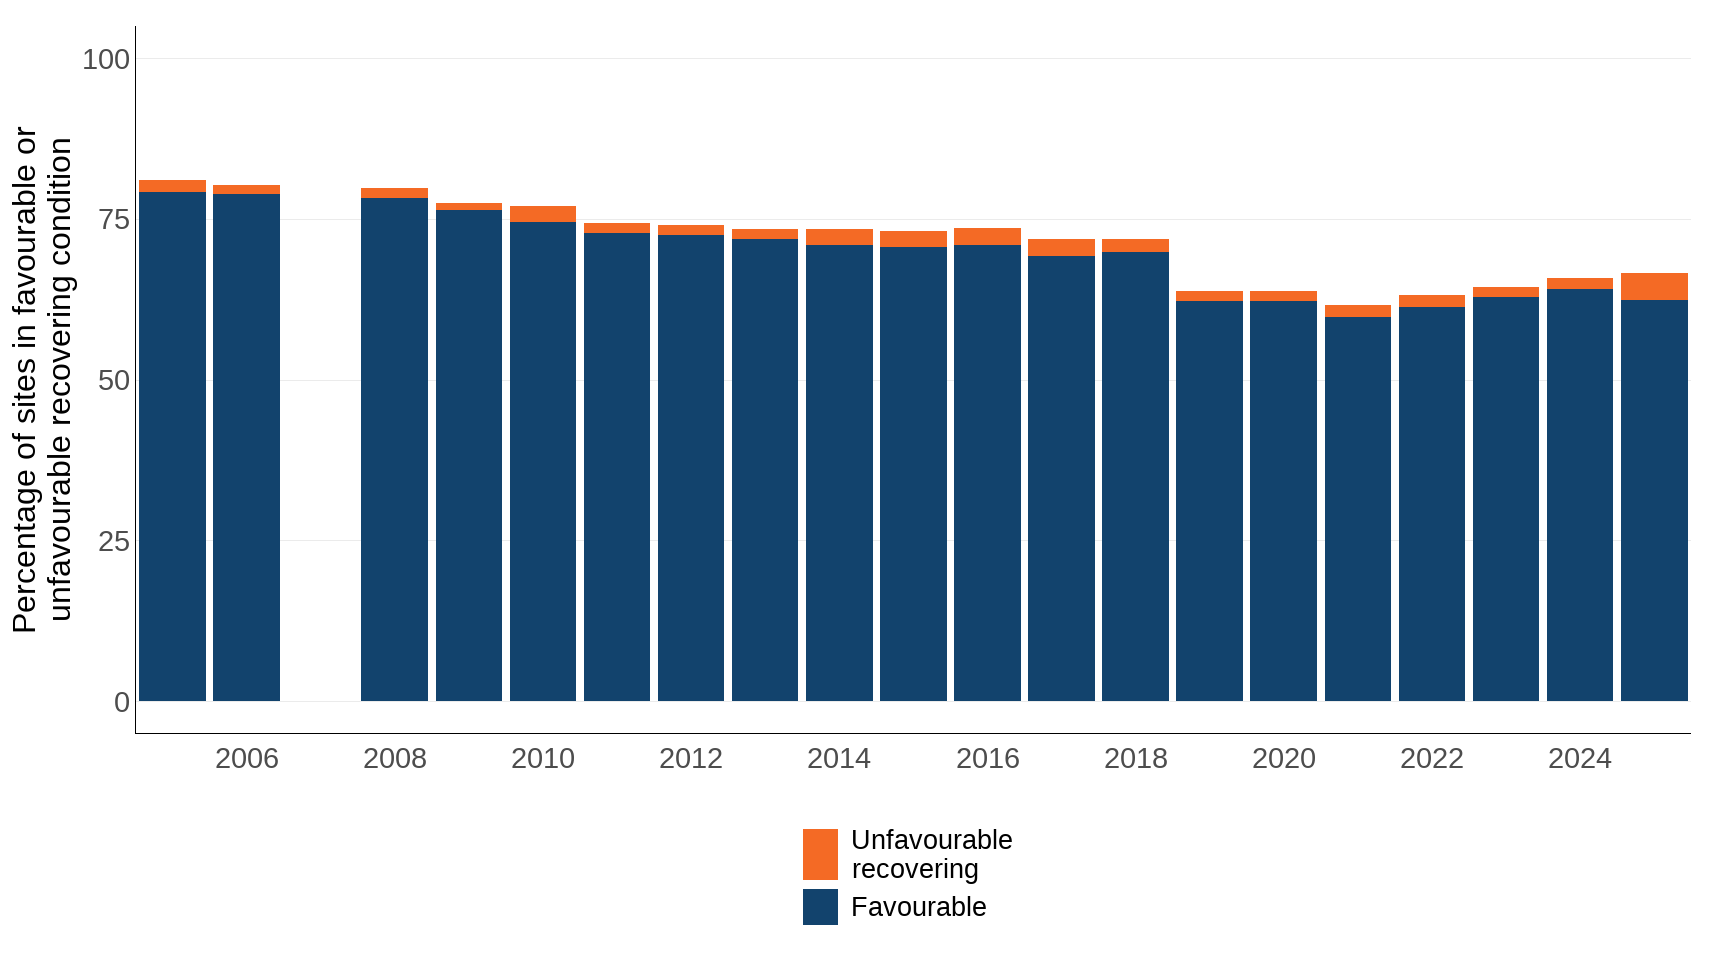
The proportion of A/SSSIs in favourable condition or in an unfavourable condition but recovering is 62% in 2025 (Figure 2). These results include data from Scotland and Northern Ireland up to 2021, and Scotland, Northern Ireland and Wales from 2022 to 2024. Natural England have provided SSSI condition data for 2024 and 2025. Historical data for SSSI condition from Natural England, based on area assessments, is not comparable and has not been included in this indicator. Figure 2 shows results both with and without data for England for 2024.
Due to these changes in the data, assessments of change have not been reported for A/SSSI condition as historical data is not comparable.
Figure 2: Cumulative proportion of Areas of Special Scientific Interest (Northern Ireland) and Sites of Special Scientific Interest Scotland, (Wales (from 2022) and England (from 2024)) in ‘favourable’ or ‘unfavourable-recovering’ condition, 2005 to 2025
Source: Natural England, Natural Resources Wales, Northern Ireland Environment Agency, NatureScot
Notes about Figure 2
- Figures from all countries are based on number of features.
- Based on data to the end of March, except in 2006 and 2008, when data are to end of December. Data were not collated in 2007.
- Imputation has been used to calculate the breakdown between favourable and unfavourable-recovering for Northern Ireland for the years 2009 to 2011.
- Figures exclude condition of Areas/Sites of Special Scientific Interest notified for geological features only.
- The data from Wales include new information which has only been available from 2022.
- Natural England previously reported data based on area. From 2023 onwards, assessments are conducted based on the number of features. Historical data for Natural England is not comparable and has not been included in these figures.
- The 2022, 2023 and 2024 results have been corrected since the 2024 publication of this indicator.
Further detail
Landscape Designations
National Parks and National Landscapes (collectively termed landscape designations) are of national importance for the conservation of wildlife and landscapes and the management of a range of ecosystem functions at the landscape scale. While recognised as a protected area under the IUCN guidelines on categorisation of protected areas, significant areas within them do not benefit biodiversity or are not ‘effectively managed or conserved for nature’. As such, landscape designations will not be included in the UK’s 30by30 reporting in their entirety, however areas within these designations types may be included in the future through other mechanisms, such as OECMs.
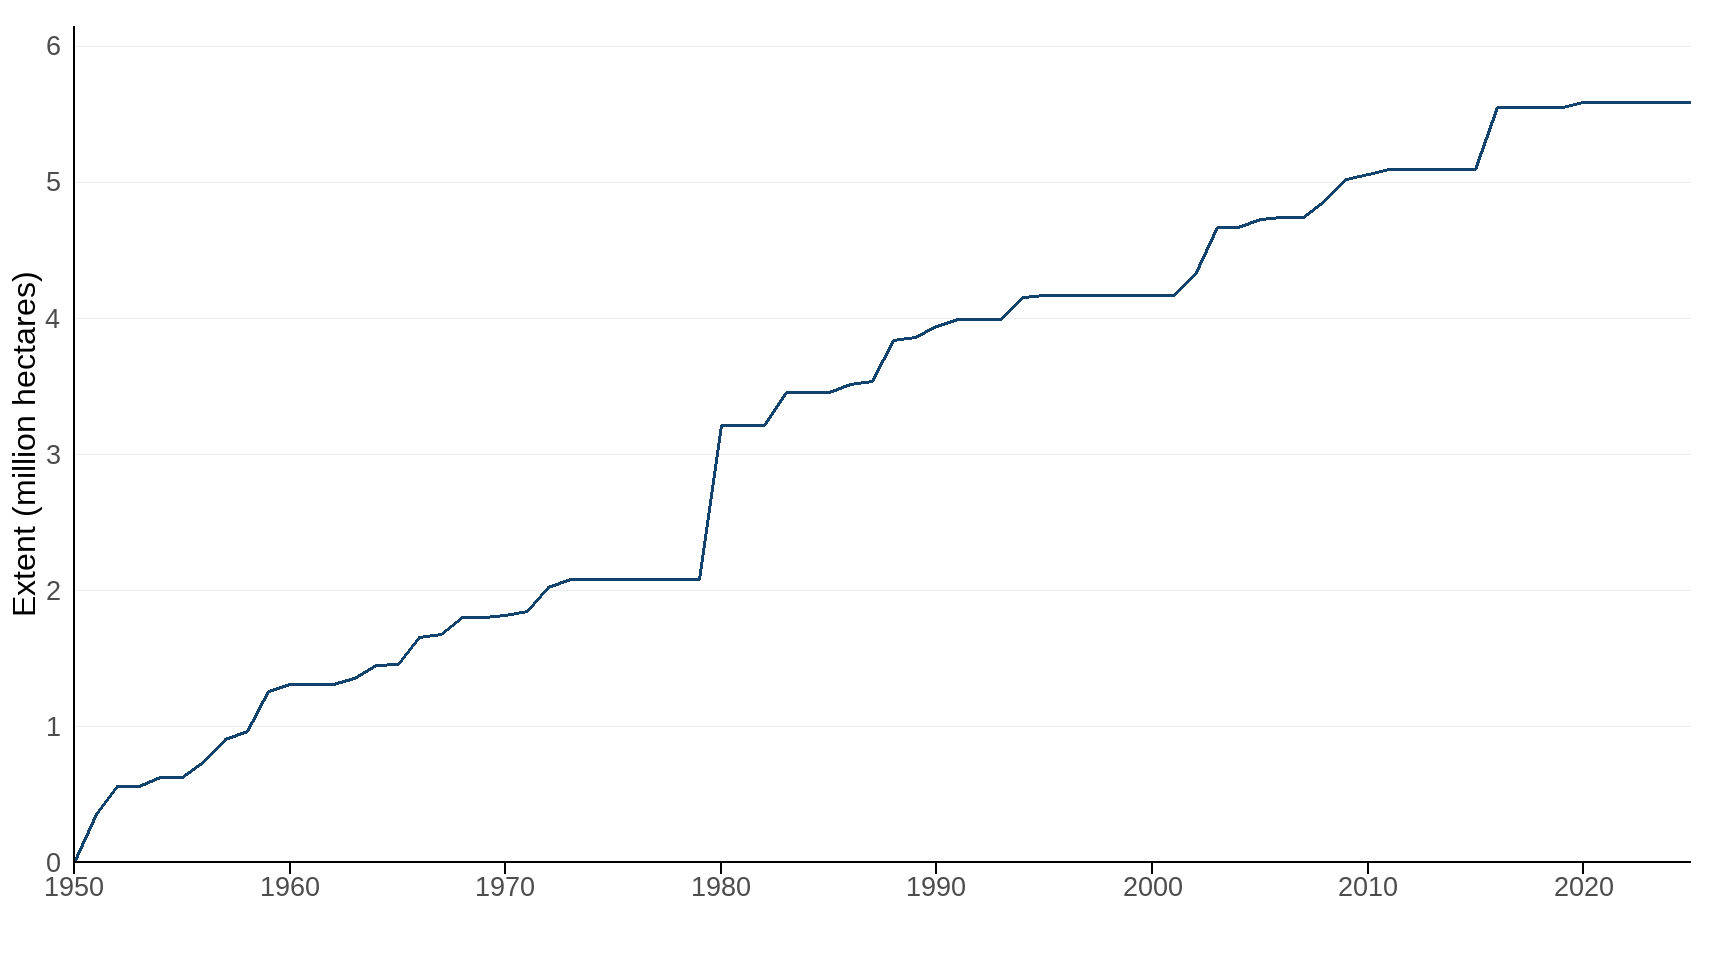
Figure 3 shows the extent of National Parks, National Landscapes (formerly known as Areas of Outstanding Natural Beauty in England and Wales), Areas of Outstanding Natural Beauty (Northern Ireland) and National Scenic Areas in the UK from 1950 to 2025.
Figure 3: Extent of Landscape Designations, 1950 to 2025
Source: Joint Nature Conservation Committee, Natural England, Natural Resources Wales, Northern Ireland Environment Agency, NatureScot
Notes about Figure 3
- The extent of landscape designations is the cumulative area assessed across the UK by 31 March of each year shown.
- Extent figures include National Parks, National Landscapes and National Scenic Areas.
- The area includes all sites within the specified designations to mean high water (MHW).
Condition of Special Areas of Conservation and Special Protection Areas
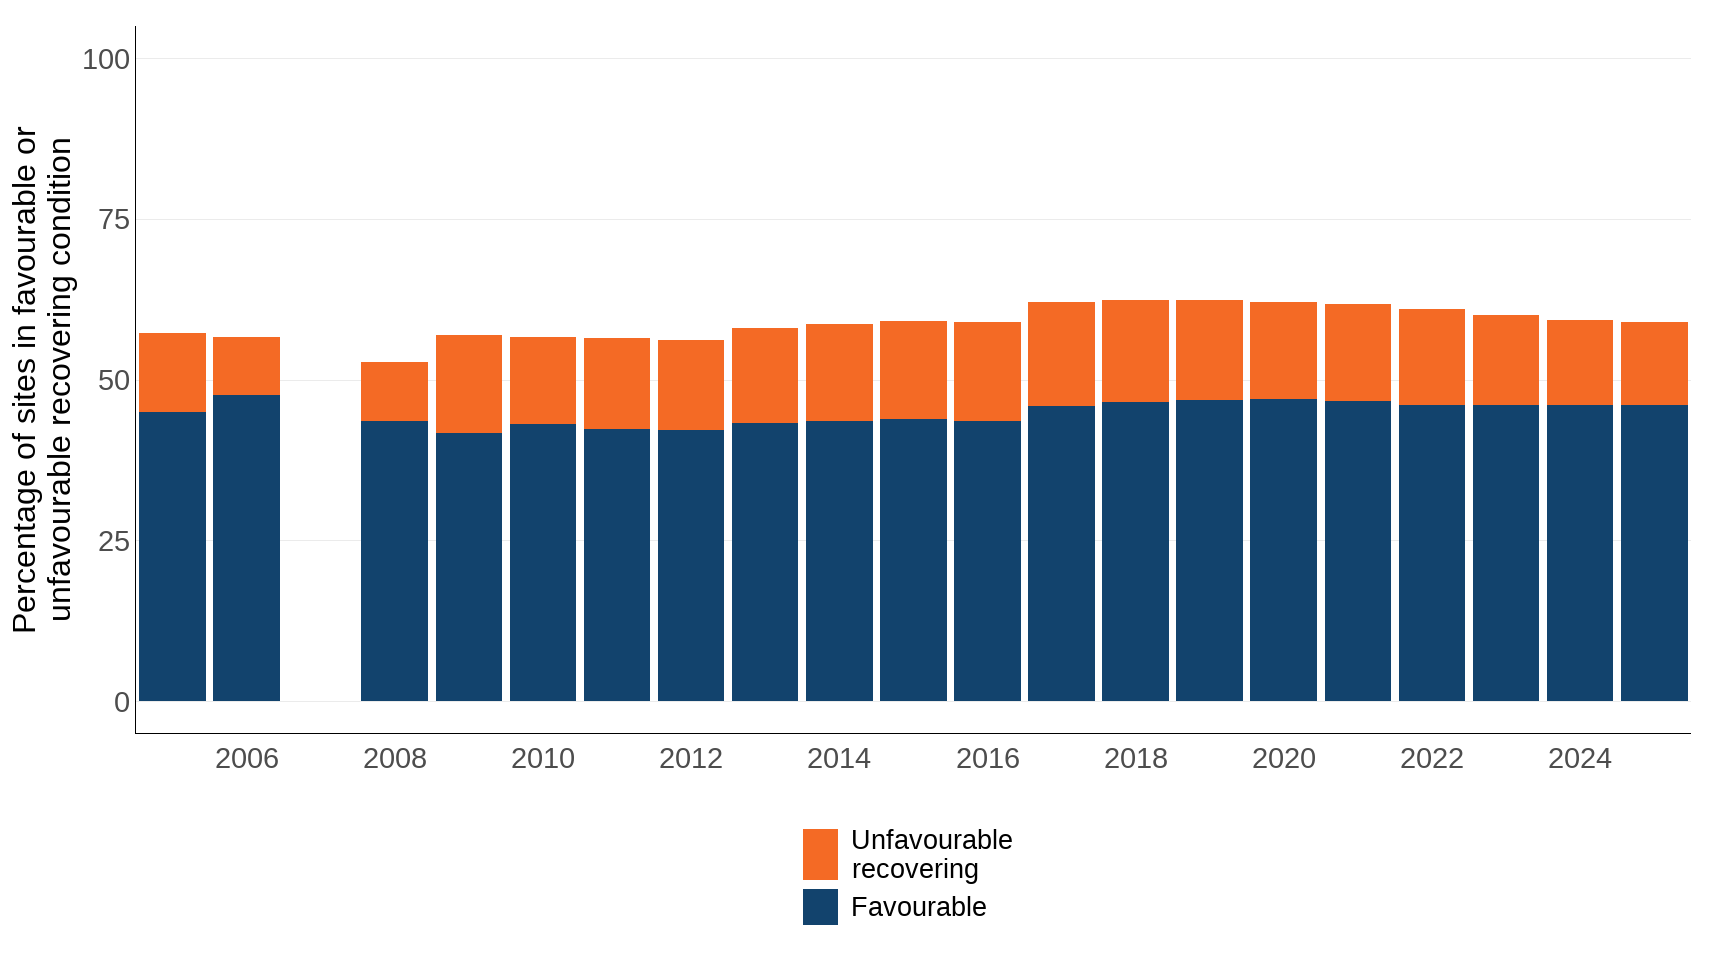
Figures 4 and 5 use the same SSSI condition data as Figure 2, but present it specifically for features on sites that are also designated as Special Areas of Conservation (SACs) and Special Protection Areas (SPAs).
SACs and SPAs are sites of European importance designated under the Habitats Regulations. SPAs protect rare and vulnerable birds and their habitats, while SACs safeguard important habitats and non-bird species. In the UK, these often overlap with Sites of Special Scientific Interest (SSSIs), which provide national-level protection and underpin many SPA/SAC designations.
The proportion of sites in favourable or unfavourable-recovering condition increased slightly from 57% in 2005 to 59% in 2025 for SACs. In the case of SPAs, this same measure decreased from 81% in 2005 to 66% in 2025.
Figure 4: Cumulative proportion of Special Areas of Conservation (SAC) in ‘favourable’ or ‘unfavourable-recovering’ condition, 2005 to 2025
Source: Natural Resources Wales, Northern Ireland Environment Agency, NatureScot
Notes about Figure 4
- Scotland, Wales, and Northern Ireland figures based on number of features.
- Figures not available for Northern Ireland (2020) and Wales (2021). Values have been carried forward from 2019 (Northern Ireland) and 2020 (Wales).
- Natural England have implemented improved quality assurance procedures which underpin the data for England, leading to delays that have prevented us from updating these data in 2025. Defra and Natural England are working together to resolve the issues as quickly as possible.
- Based on data to the end of March, except in 2006 and 2008, when data are to end of December. Data were not collated in 2007.
- Imputation has been used to calculate the breakdown between favourable and unfavourable-recovering for Northern Ireland for the years 2009 to 2011, and for Wales for the years 2008 to 2012.
- Includes coastal and inshore but not offshore sites.
Figure 5: Cumulative proportion of Special Protection Areas (SPA) in ‘favourable’ or ‘unfavourable-recovering’ condition, 2005 to 2025
Source: Natural Resources Wales, Northern Ireland Environment Agency, NatureScot
Notes about Figure 5
- Scotland, Wales, and Northern Ireland figures based on number of features.
- Figures not available for Northern Ireland (2020) and Wales (2021). Values have been carried forward from 2019 (Northern Ireland) and 2020 (Wales).
- Natural England have implemented improved quality assurance procedures which underpin the data for England, leading to delays that have prevented us from updating these data in 2025. Defra and Natural England are working together to resolve the issues as quickly as possible.
- Based on data to the end of March, except in 2006 and 2008, when data are to end of December. Data were not collated in 2007.
- The figures for December 2006 were calculated by imputation based on the figures in March 2005 and December 2008 for England, as a breakdown was not provided.
- Includes coastal and inshore but not offshore sites.
Relevance
Designation and management of protected areas are key mechanisms for taking action to reverse the loss of biodiversity. These protected areas cover many of the most valuable sites for biodiversity in the UK with associated legal mechanisms for safeguarding habitats and species. Wider landscape designations have a number of purposes, including conservation and public enjoyment.
In a densely populated country like the UK, where the landscape and habitats have been modified by centuries of use, protected areas often need to be actively managed to ensure the species and habitats they contain persist into the future. The condition indicator is a measure of the outcomes of management action and conservation policy on protected areas.
International/domestic reporting
The suite of UK Biodiversity Indicators has been revised and updated to bring it in line with the Kunming-Montreal Global Biodiversity Framework (GBF). Some UK Biodiversity Indicators will be used for the forthcoming UK national reports to the Convention on Biological Diversity (CBD).
This indicator has been adapted to align with headline indicator 3.1 Coverage of protected areas and other effective area-based conservation measures, relevant to Goal A and Target 3 of the GBF.
Web links for further information
- Framework for 30by30 in Scotland
- A 30by30 framework for Wales
- 30by30 on land in England: confirmed criteria and next steps
- Kunming-Montreal Global Biodiversity Framework (GBF)
- Kunming-Montreal Global Biodiversity Framework (GBF Target 3)
- Headline Indicator 3.1 Coverage of Protected Areas and OECMs
- Common Standards Monitoring Programme
- Resource hub
- Broad information on Surveillance and Monitoring
- Natural England Condition information
- NatureScot Protected areas
- Natural Resources Wales Protected areas of land and sea
- Natural Resources Wales Protected sites baseline assessment
- Natural Resources Wales Indicative feature condition assessments for European marine sites
- DAERA Protected areas
- The National Landscapes Association
- National Parks, Introduction and links
- NatureScot, Introduction and links
- Joint Nature Conservation Committee, Marine Conservation Zones Site Information
- Joint Nature Conservation Committee, Marine Protected Areas Site Information
- Joint Nature Conservation Committee, Ramsar Convention Site Information
Acknowledgements
Thank you to the many people who have contributed by providing data and to the many colleagues who have helped produce this indicator.
Technical annex
Methodology
This indicator is comprised of four measures:
A. Land which is protected or conserved and effectively managed, on land and at sea
B. Extent of formally protected areas, on land and at sea
C. Land outside of formally protected areas that conserves biodiversity (OECMs)
D. Land which is effectively managed for biodiversity
Method for calculating area protected or conserved and effectively managed, on land and at sea
Measure (A) is assessed using country specific 30by30 criteria for areas protected or conserved for biodiversity and effectively managed. At present, data is not currently available for England, Scotland, Wales or Northern Ireland. These will be added once these data become available.
Method for calculating the total extent of formally protected areas, on land and at sea
Measure (B) is calculated using a computer program written by the Joint Nature Conservation Committee (JNCC) which uses a number of spatial site designation files as input, and calculates a set of non-overlapping polygons for that entire set of designations for each year. The programme also splits the areas calculated into terrestrial, inshore (within 12 nautical miles of the coast), and offshore (beyond 12 nautical miles out to the edge of the UK Continental Shelf). Inshore and offshore extent are combined for extent at sea.
The total areas of the terrestrial and marine regions are calculated using the following datasets:
(1). Boundaries (regions):
- Mean High Water (mean high water spring for Scotland) feature from the Ordnance Survey MasterMap dataset.
- Open Data Northern Ireland outline. MHW and Republic of Ireland boundary.
- Inshore (12 nautical miles) applied as a buffer to the terrestrial boundary.
- Boundary-Line (OSMM) for the terrestrial country borders within Great Britain.
- A UK Water boundary dataset used in the ‘country’ cutting data. Data supplied by JNCC Marine Team. Contains exclusive economic zone, UK Continental Shelf and Northern Ireland meridian polygons.
- An area for Northern Ireland Offshore.
(2). Protected Areas (sites):
- SAC datasets downloaded from each of the four Statutory Nature Conservation Bodies (SNCBs) websites.
- UK collation of offshore SACs, administered by JNCC.
- SPA datasets downloaded from each of the four SNCB websites.
- Ramsar datasets downloaded from each of the four SNCB websites.
- A/SSSI datasets downloaded from each of the four SNCB websites.
- NNRs, downloaded from each of the four SNCB websites.
- MCZs data collated by JNCC for submission to the European Environment Agency nationally designated protected areas inventory (CDDA).
- Highly Protected Marine Areas datasets, collated by JNCC
- Nature Conservation MPAs, downloaded from NatureScot website.
Many protected areas in the UK cover the same physical parcels of land, but for different reasons; as a result the designation types can overlap. For example, it is possible for an individual site to be designated as a Site of Special Scientific Interest (SSSI), Special Area of Conservation (SAC), Special Protection Area (SPA), Ramsar site and National Nature Reserve (NNR). A computer program is run which checks through all the site boundaries and their designated dates, compares them with all other sites and removes overlapping areas which were designated later, until only sites (or parts thereof) which do not overlap with any other sites which were designated before remain. These non-overlapping site boundaries are then intersected with the region boundaries; all site boundaries designated before or during each year which intersect each region are selected and summed.
This creates a total protected area figure for each region, for each year, where each parcel of land contributes only once to the total area figure.
Method for calculating land outside of formally protected areas that conserves biodiversity (OECMs)
Measure (C) is assessed using country specific criteria for OECMs. Frameworks for recognising OECMs are being developed across the four countries of the UK as a key tool to help meet the international 30by30 target. At present, data is not currently available for England, Wales or Northern Ireland. These will be added once these data become available.
Scotland have published draft criteria in the Development of OECMs in Scotland. The results from these assessments are shown in Table 2.
Method for calculating land which is effectively managed
Currently robust data on the effectiveness of the UK’s protected area network are not readily available. At present only data on the condition of Areas or Sites of Special Scientific Interest (A/SSSIs) across the UK is available.
Measure (D) Condition of Areas / Sites of Special Scientific Interest is calculated from country level Common Standard Monitoring data for A/SSSIs. A/SSSI sites can be designated for biological features (species or habitats), or geological features (e.g. fossils, or particular rock types / formations), or may have a mix of both biological and geological features. As this is a set of biodiversity indicators, measure (D) is intended to focus on the biological features, and therefore is weighted by the sites designated for those features (i.e. biological or mixed sites).
A report on the CSM programme was published by JNCC in 2006 based on data to the end of March 2005. Since then the countries of the UK have continued to evaluate the effectiveness of site management, but have customised their approach to national circumstances. In Scotland, Wales and Northern Ireland assessments are undertaken on a feature by feature basis. In 2023, Natural England changed the way that it monitors and reports the condition of site of special scientific interest (SSSIs). Prior to 2023, condition assessments were undertaken at the scale of SSSI units (mentioned above), where units are a subdivision of SSSIs usually based on land ownership. Since 2023, condition assessments are now undertaken at the whole scale of the notified feature, where a notified feature can be present on a SSSI across one or more SSSI units.
Constraints:
- The UK indicator needs to be based on country level assessments of the condition of protected areas and the features on them.
- From 2023, data from England has changed from area based assessments to feature assessments. For consistency, historical data, based on area assessments, has not been included in this indicator, but can be found in the Extent and condition of protected areas in England.
- Wales do not have data for SSSIs prior to 2022.
The processes for producing the indicator are reliant on the quality of the data downloaded from SNCB’s websites.
Calculation of the percentage of sites in favourable or unfavourable recovering condition (for each year) is as follows:
Step 1. Spatial data on the area of biological and mixed biological/geological A/SSSI sites are downloaded from the SNCB’s websites.
Step 2. Extent data for A/SSSIs, SACs and SPAs are calculated using the same program as that used for the extent measures, but just for one site type. This allows calculation of the proportion of the site networks in each country.
Step 3. Data on the percentage of each site type in favourable condition or in unfavourable recovering condition are provided by each country.
Step 4. The proportion of the site network in favourable or unfavourable-recovering condition is multiplied by the area of that site network in a country to create an area equivalent (i.e. the area favourable or area recovering for a country for each of A/SSSI, SAC or SPA).
Step 5. The area calculated in step 4 is divided by the total area of the site type across the UK, to create a weighted proportion of the site type for the UK from that country.
Step 6. The percentage for each country is summed to provide a composite figure for the UK for a site type.
Background
Extent
The extent of protected areas in Figure 1 is the combined (net) area of:
- Nationally designated National Nature Reserves (NNR), Sites of Special Scientific Interest (SSSI) in England, Scotland and Wales, and Areas of Special Scientific Interest (ASSI) in Northern Ireland.
- Marine Conservation Zones (MCZ) in English, Welsh and Northern Irish waters, Highly Protected Marine Areas (HPMA) in English waters and Nature Conservation Marine Protected Areas (NCMPA) in Scottish waters.
- Internationally important Special Protection Areas (SPA) and Special Areas of Conservation (SAC), and sites designated under the Convention on Wetlands of International Importance (Ramsar).
There is considerable geographic overlap between these designations: for example, many sites are designated as A/SSSI, SAC and SPA. Almost all Ramsar sites are underpinned by the A/SSSI designation, and most Ramsar sites are also SPAs. The calculation method used identifies non-overlapping areas or ‘polygons’, and thus ensures that each protected area contributes only once to the total area. Coastal sites are split at mean high water (mean high water spring for Scotland), and contribute to both the on-land and at-sea lines in Figure 1 as appropriate.
Figure 6: Map of UK terrestrial and marine protected areas, as at 31 March 2025
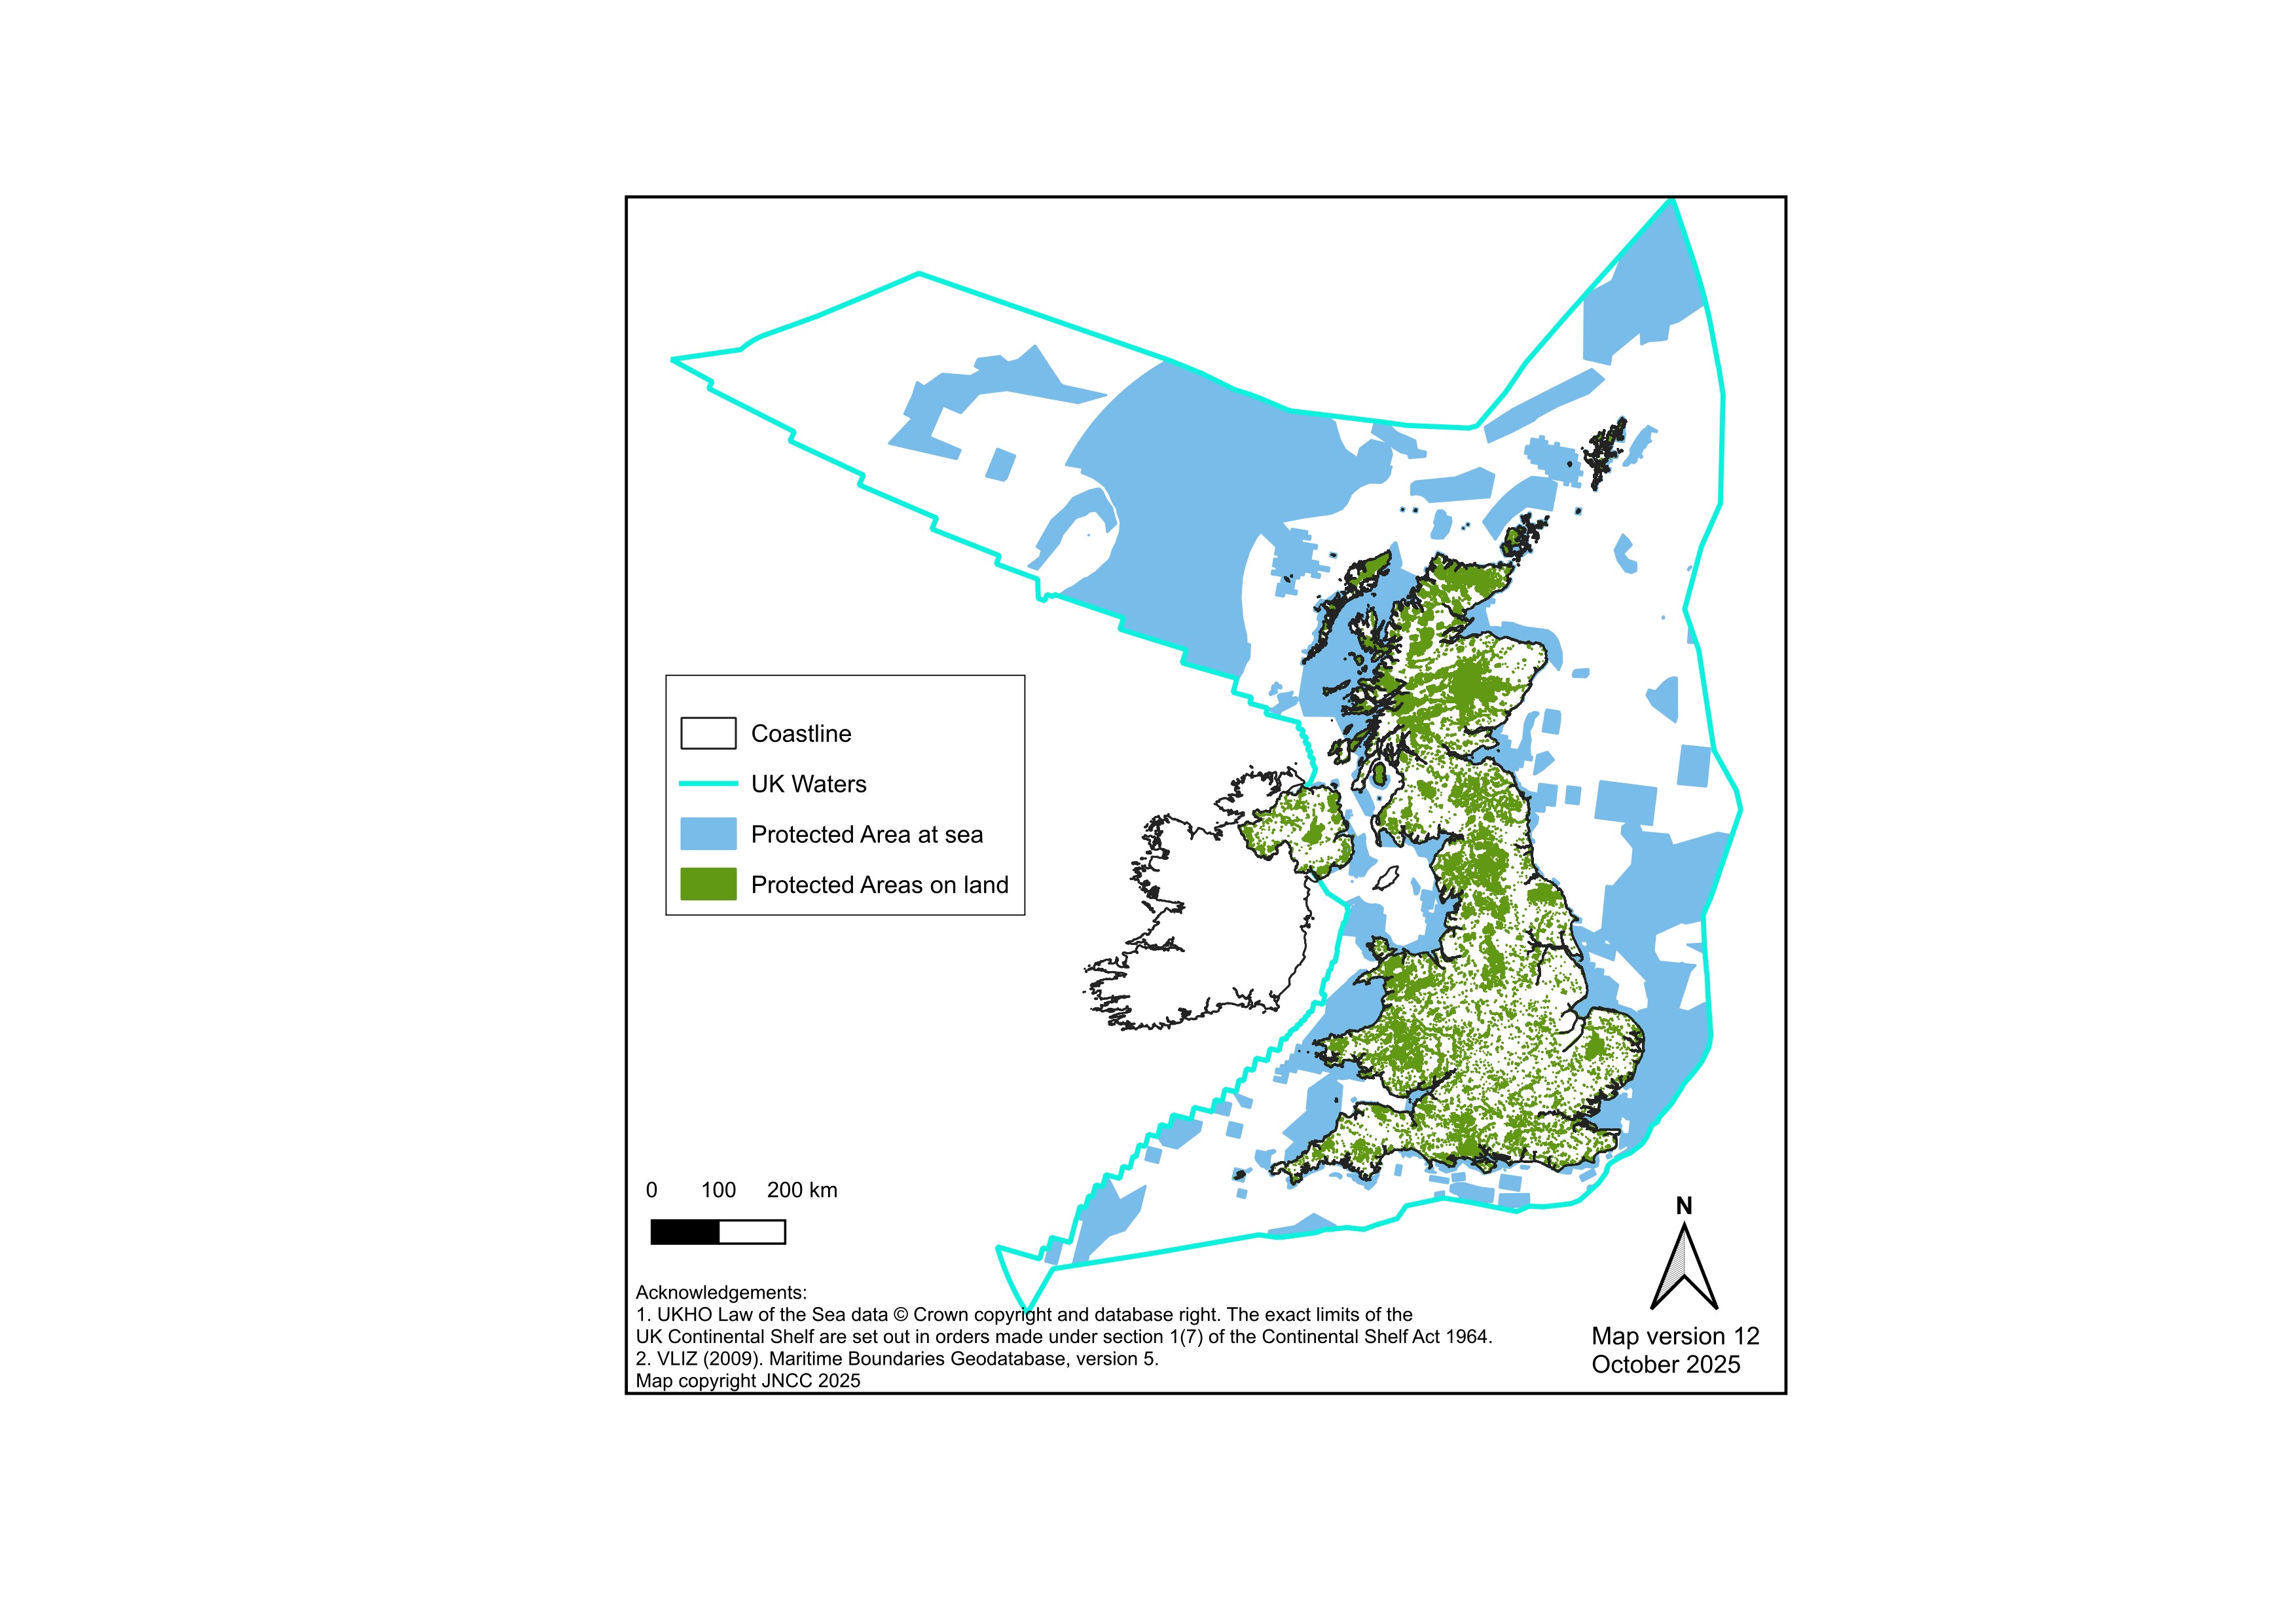
Source: Joint Nature Conservation Committee, based on its own data and data from Natural England, Natural Resources Wales, Northern Ireland Environment Agency and NatureScot
Notes about Figure 6
- Includes the following site designations: Areas of Special Scientific Interest (Northern Ireland), Sites of Special Scientific Interest (England and Scotland), National Nature Reserves, Marine Conservation Zones, Highly Protected Marine Areas, Nature Conservation Marine Protected Areas, Ramsar Sites, Special Areas of Conservation , Special Protection Areas.
Changes in the terrestrial extent measures since 1995 mainly reflect the establishment of SACs and SPAs. There has been a large increase in the extent of Marine Protected Areas (MPAs) since 1995, but especially since 2010. In 1995 and 1996, the first set of sites under the EU Habitats Directive extending below mean high water were established. These inshore and coastal SACs may also have a terrestrial/freshwater component, but the calculations to create the indicator split them between the on-land and at-sea lines in the indicator. Marine sites totalling 5 MHa were designated in 2016 and 2017 for harbour porpoise. In May 2019, a third tranche of 41 MCZs in English and Welsh waters were designated covering a total of 1.17 MHa. In September 2020 a very large deep water offshore MPA was designated by the Scottish Government which added 9.9 MHa to the indicator (captured in the 2020 publication of the indicator). In December 2020, a further 4 NCMPAs and twelve SPAs were designated by the Scottish Government, adding a further 2.06 MHa increase to the at-sea extent component of the indicator.
Condition
A/SSSIs are designated with the aim of conserving specific biological or geological features. A monitoring programme was initiated in 1998 to evaluate the outcomes of management action and conservation policy. Under this programme, the condition of these features is assessed on a rolling cycle against agreed standards. The indicator (Figure 2) identifies the proportion of these features that are in a desired state (favourable) or have appropriate management but are yet to have regained their favourable status (unfavourable-recovering). The underpinning legislation for A/SSSIs extends to low water, so the condition part of the indicator is mainly based on terrestrial features.
The UK-wide Common Standards Monitoring programme is undertaken by the statutory nature conservation bodies to assess the effectiveness of management action aimed at maintaining or restoring the features for which protected areas have been designated. The data presented for this indicator are for the biological (species and habitats) features only; the monitoring of condition of features is also undertaken for geological features. Conservation objective(s) will have been set for each feature or site. The monitoring tests whether these objectives have been met.
Sites may have one or more interest features on them and each of these is assessed separately. Conservation objectives are developed by identifying the key attributes which make up or support the feature (e.g. extent, quality, supporting processes), and setting targets for them. Each attribute is then measured and compared against the target value set. If all the targets are met, the feature is in favourable condition. Human activities which are likely to be affecting the site adversely, and the conservation measures taken to maintain or restore the site, are also recorded. Sampling and assessment methods may vary between countries.
Sites or features which have yet to be assessed are excluded from the indicator; effectively this means the indicator is based on terrestrial and coastal features.
The first collation of results (to March 2005) was published by the Joint Nature Conservation Committee in 2006. The cut-off date is 31 March each year unless otherwise stated. The condition graph is cumulative and includes assessments from a number of years. As new assessments are completed they replace the previous ones; so the graph is a snapshot of the condition of the site network at that point in time. Both unfavourable-recovering and favourable assessments are shown in the graph, as it will take many years to reverse previous declines in species populations, or to restore the ecological functioning of habitats.
The assessment of change on the condition of A/SSSIs is based on the combined favourable and unfavourable-recovering condition results for features.
Development plan
This indicator will be further developed to align with the methodology of Headline Indicator 3.1 of the Global Biodiversity Framework. This ongoing development will focus on incorporating management effectiveness data for protected areas, including the use of the Management Effectiveness of Protected and Conserved Areas (MEPCA) indicator in both terrestrial and marine areas. Country level data will also be added to this indicator once these becomes available.
We are keen to hear from our users about these plans, as well as our published development plan, please email us.
Categories:
Published: