Mammals of the wider countryside (bats)
Last updated: 2025
Latest data available: 2024
Introduction
This indicator shows changes in the relative abundance of 11 of Great Britain’s 17 breeding bat species, based on data from transect surveys, roost emergence counts and counts at hibernation sites. Whilst 11 species are included there are only 10 trends, as an aggregate trend is used for the whiskered bat (Myotis mystacinus) and Brandt’s bat (Myotis brandtii); these two species are difficult to distinguish between in the field. Bat species make up a third of Great Britain’s native mammal fauna and occur in most lowland habitats across Great Britain.
Data for this indicator can be found in the published datafile, we also have a similar indicator at the England level.
Type of indicator
State indicator
Type of official statistics
Official statistic
Assessment of change
Change in the abundance of bat populations:
| Measure | Assessment | Time period | Result |
|---|---|---|---|
| Bat populations | Long term | 1999 to 2023 | Improving |
| Bat populations | Short term | 2018 to 2023 | Improving |
Notes on the indicator assessment
- To better capture patterns in the data, where possible, long-term and short-term assessments are made on the basis of smoothed data, with analysis of the underlying trends being performed by the data providers.
Key results
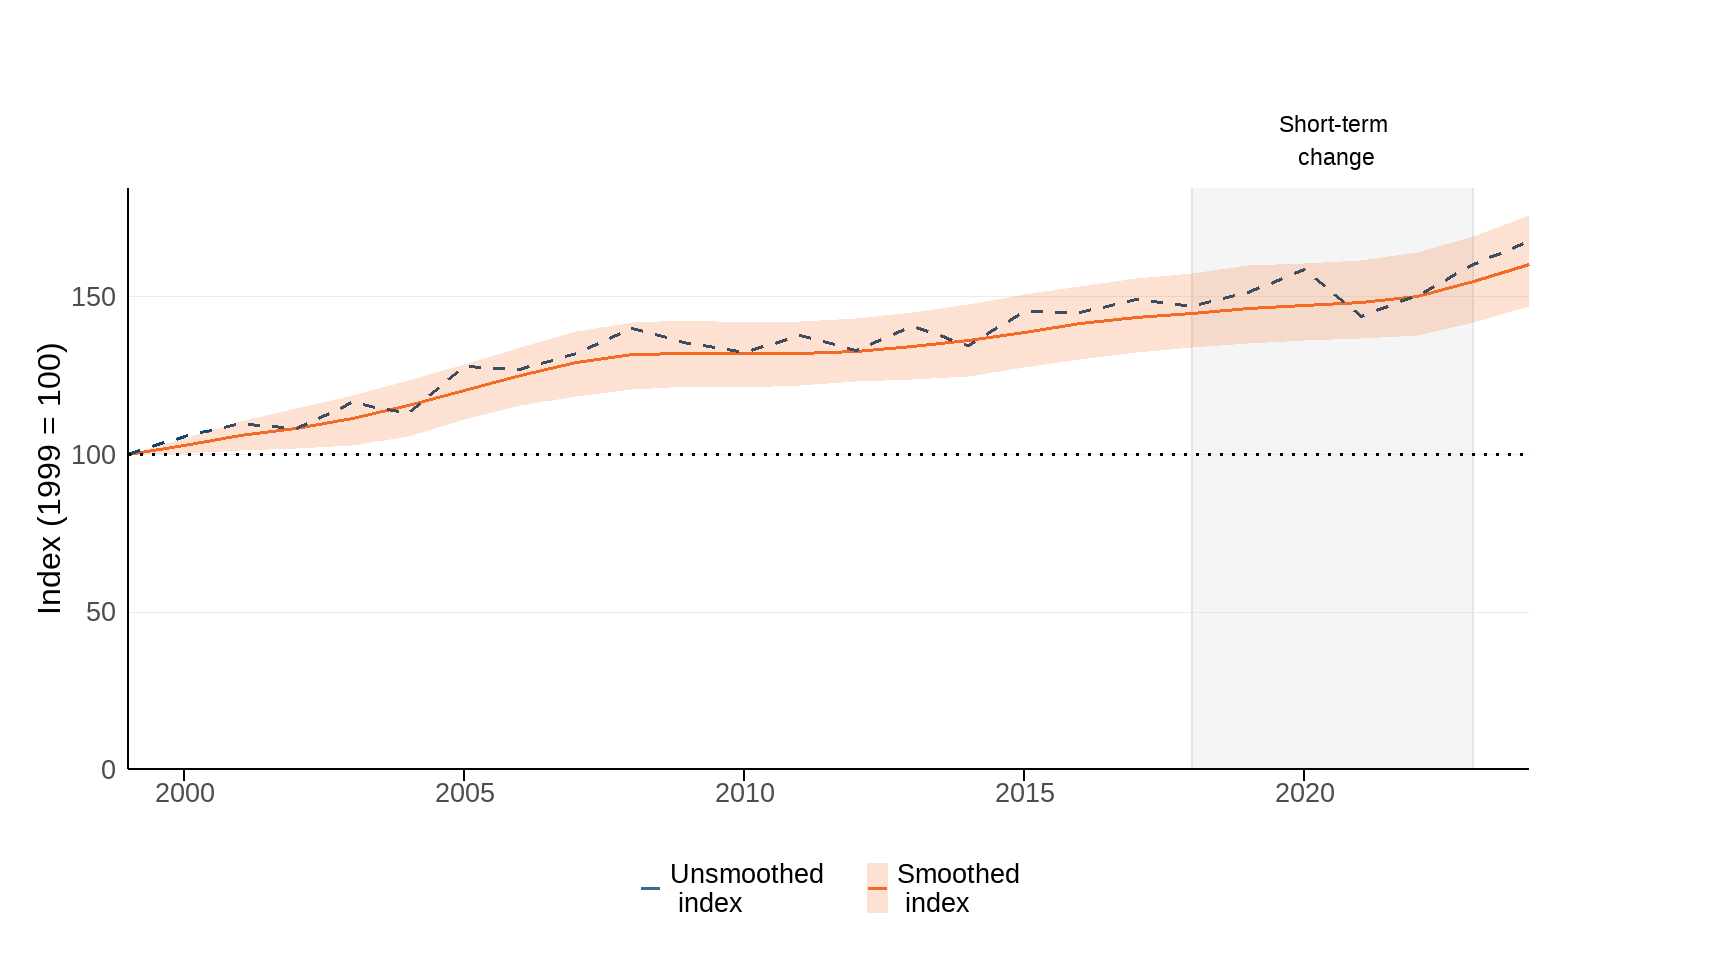
The smoothed bat index has increased by 55% between 1999 and 2023. In the short term, between 2018 and 2023, the bat index has increased by 7% (Figure 1).
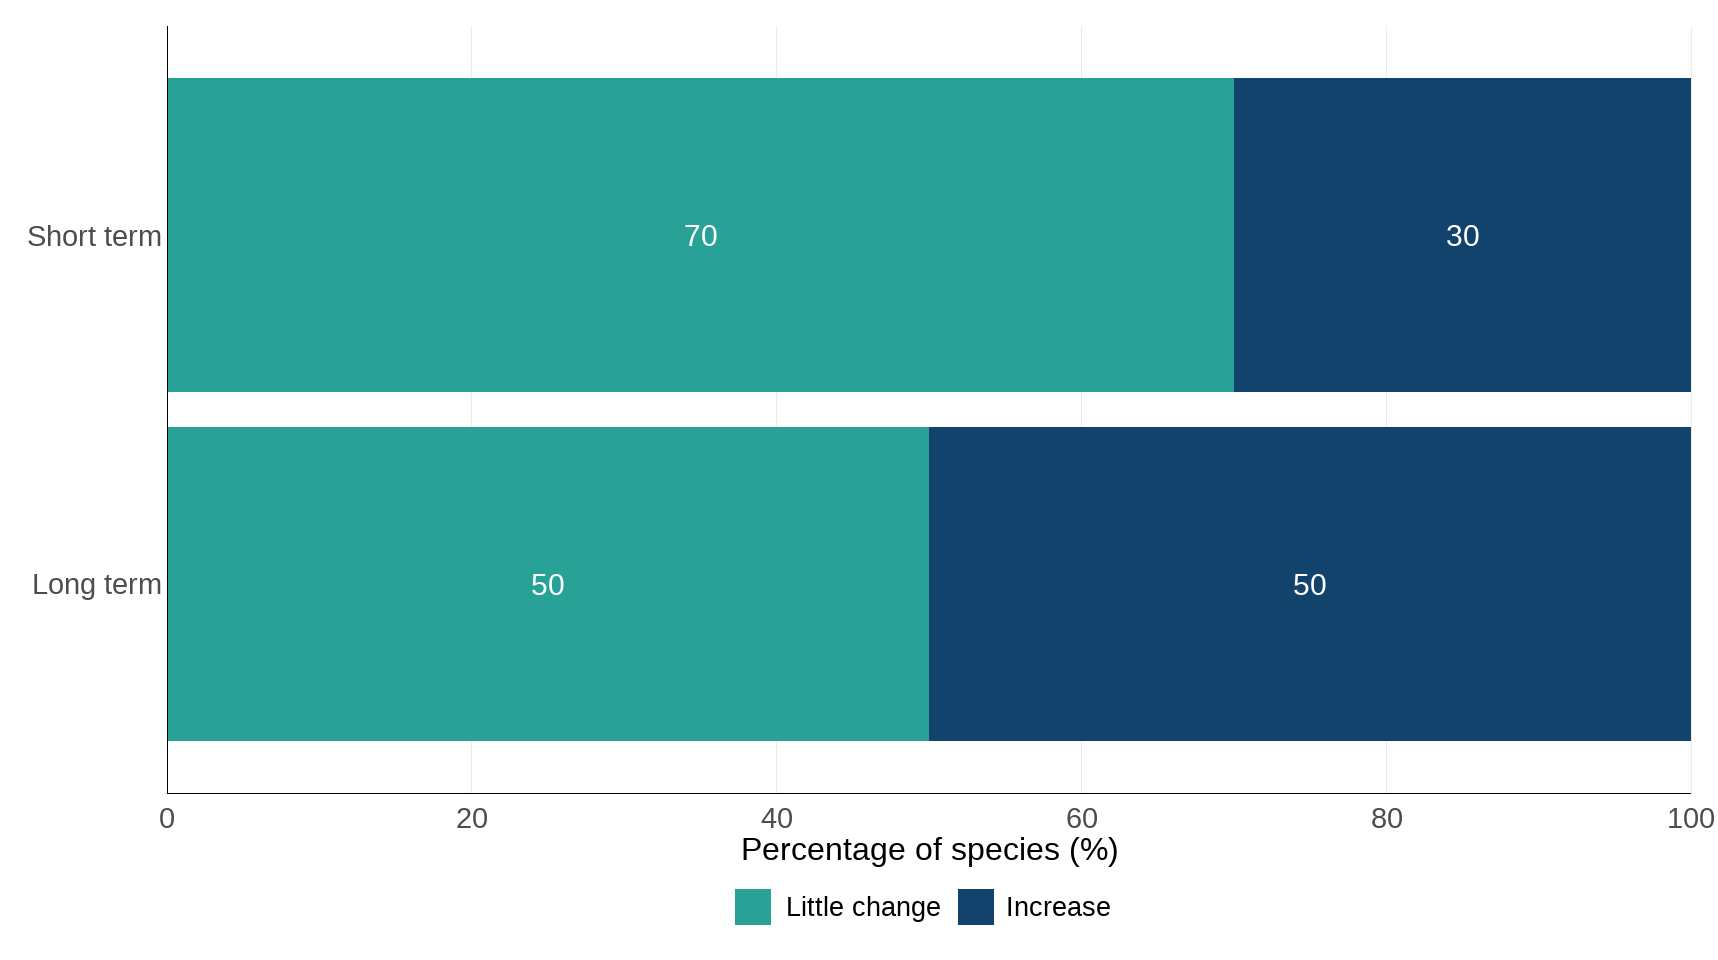
The bat index is a composite of 10 trends (including 11 species, two of which are combined in a single trend). The smoothed bat index increased every year between the 1999 baseline and 2009, it was relatively stable between 2009 and 2013, before increasing again from 2013 to 2024. The composite indicator masks variation between the species that contribute to it. The long-term increase in the indicator is primarily driven by strong increases in three species: greater horseshoe bat, lesser horseshoe bat and common pipistrelle. Between 1999 and 2023, the combined survey trends for these species increased by 232%, 125% and 87% respectively. Two other species showed weaker increases over the same period, and the remaining five species groups showed no meaningful change (Figure 2). These increases indicate that some bat species are starting to recover after what are believed to have been major population declines prior to and during the 20th century.
In the short term, between 2018 and 2023, greater horseshoe bat, lesser horseshoe bat, and serotine have increased significantly, and the remaining species/species groups show no meaningful short-term change. No species show a decline in either the long or short term, however it is not possible to produce separate trends for whiskered bat and Brandt’s bat, as they cannot be reliably distinguished between in the field. It is therefore possible that an increase in one species could mask a decline in the other. It is also important to note that GB’s rarer and more specialised bat species are not included in the index due to difficulties monitoring these species.
Figure 1: Trends in 11 bat species’ populations in Great Britain, 1999 to 2024
Source: Bat Conservation Trust
Notes about Figure 1
- The line chart shows the unsmoothed trend (dashed line) and the smoothed trend (solid line) together with its 95% confidence interval (shaded area).
- This indicator includes 10 trends, comprising individual measures for 11 species of bats. An aggregate trend is used for whiskered bat and Brandt’s bat; these two species have been combined due to difficulties distinguishing between them in the field.
Figure 2: Long-term and short-term changes in individual bat species trends in Great Britain, 1999 to 2023
Source: Bat Conservation Trust
Notes about Figure 2
- The bar chart shows the percentage of species groups within the indicator that have increased, decreased or shown little change.
- This indicator includes 10 trends, comprising individual measures for 11 species of bats. An aggregate trend is used for whiskered bat and Brandt’s bat; these two species have been combined due to difficulties distinguishing between them in the field.
Further detail
For information on the methods used in this indicator, please see the Technical Annex below.
Relevance
Bat populations utilise a range of habitats across the landscape and are sensitive to pressures in the urban, suburban and rural environment. All bats and their roosts are protected by domestic legislation. The UK is a signatory to the EUROBATs agreement, set up under the Convention on Migratory Species, with the intention of conserving all European bat populations. The wider relevance of bats as biodiversity indicators is presented in Jones et al., (2009).
International/domestic reporting
The suite of UK Biodiversity Indicators has been revised and updated to bring it in line with the Kunming-Montreal Global Biodiversity Framework (GBF) of the Convention on Biological Diversity (CBD). Some UKBIs will be used for the forthcoming UK national reports to CBD.
Web links for further information
- Bat Conservation Trust: The National Bat Monitoring Programme
- Joint Nature Conservation Committee: Population trends for bat species in the UK
- EUROBATS: The Agreement on the Conservation of Populations of European bats
- European Environment Agency European: Bat population trends
Acknowledgements
Thank you to the volunteers who collect data on behalf of the National Bat Monitoring Programme, to the workshop leaders who provide volunteer training, and to the many colleagues who have helped produce this indicator.
Technical Annex
Methodology
The GB bat index is produced by the Bat Conservation Trust using data collected annually from the National Bat Monitoring Programme (NBMP). This programme began in 1997 and currently delivers population trends for 11 of Great Britain’s 17 breeding bat species (two of which are combined). It has deployed 4,471 volunteers to record bat population data at 7,398 sites (Figure 3).
In 2018 this indicator was extended from 8 species to 11 bat species. Data were updated for the entire time series to include all 11 bat species.
Figure 3: Location of National Bat Monitoring Programme monitoring sites
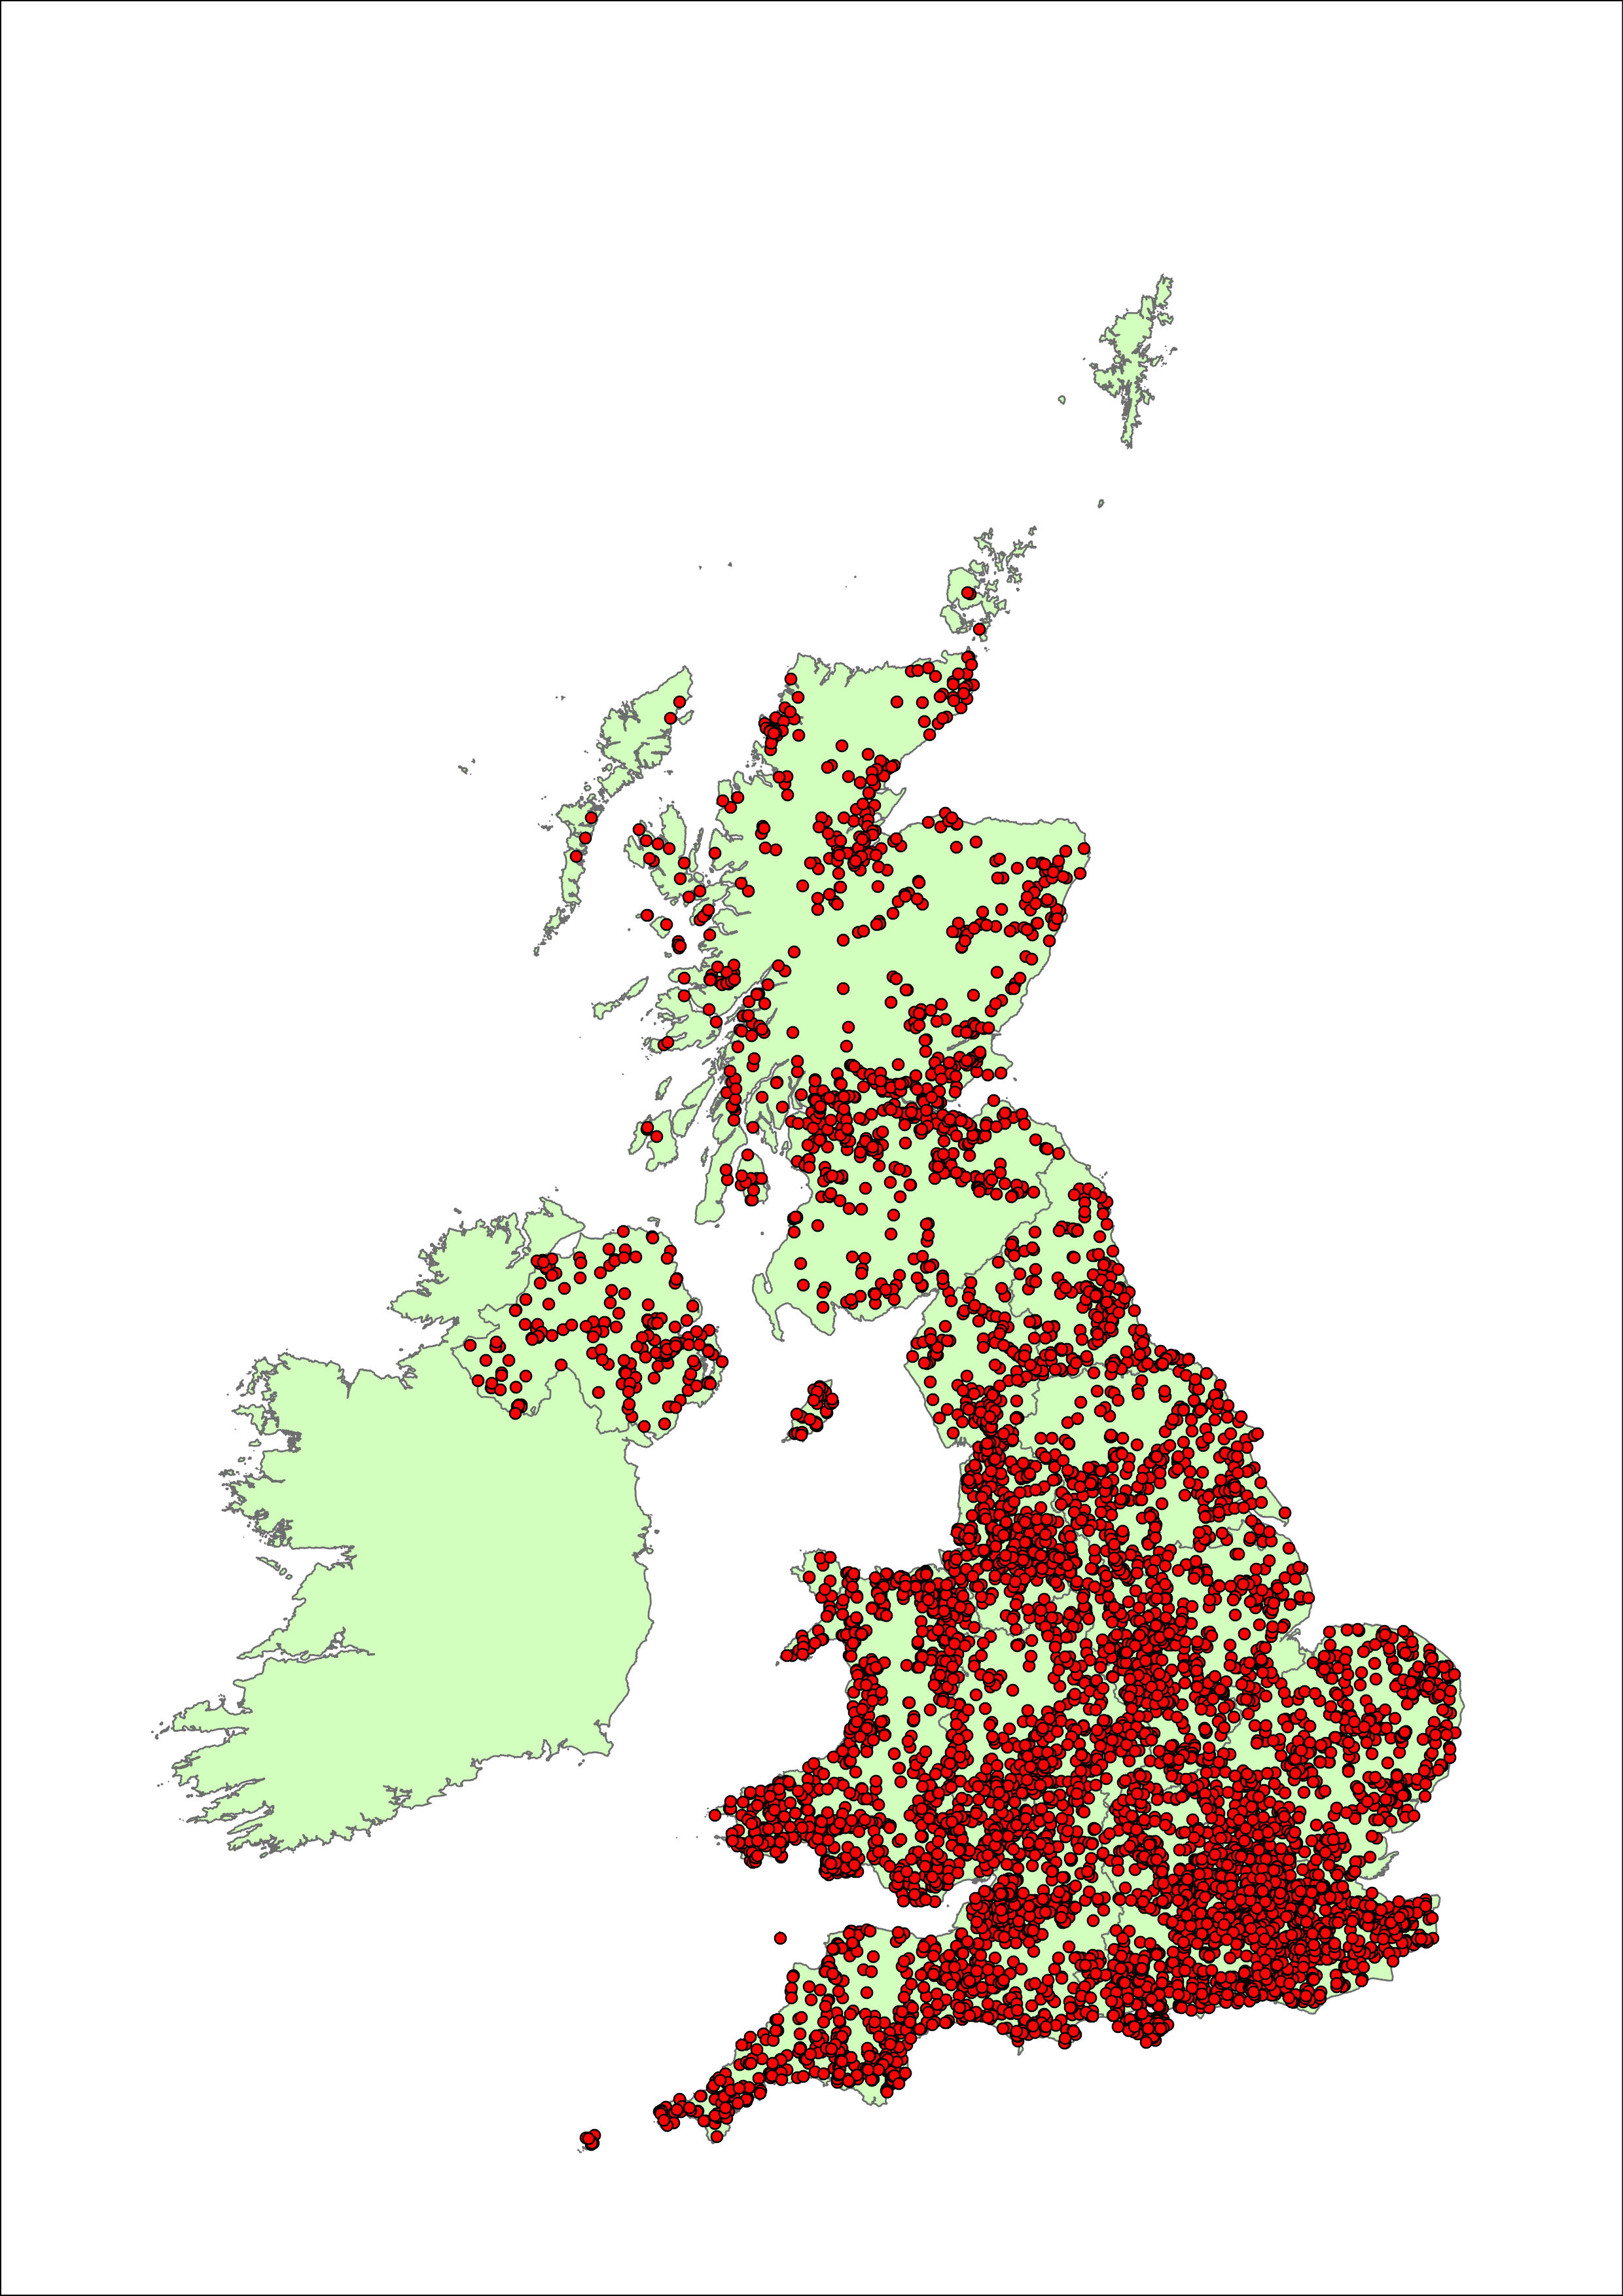
Source: Bat Conservation Trust
This indicator shows changes in the relative abundance of 11 of GB’s 17 breeding bat species: brown long-eared bat, common pipistrelle, Daubenton’s bat, greater horseshoe bat, lesser horseshoe bat, Natterer’s bat, noctule, serotine, soprano pipistrelle and whiskered/Brandt’s bat (the latter two species cannot be distinguished between during monitoring surveys and so are treated as one species group). It is compiled by the Bat Conservation Trust using data collected annually from the National Bat Monitoring Programme (NBMP). Surveys for these species include summer roost emergence counts, counts at hibernation sites and visual and/or acoustic observations made along predetermined transects. Most species are surveyed by two different survey methods, both of which are included in the index apart from summer roost count data for common and soprano pipistrelle. Pipistrelle species’ frequent ‘roost switching’ causes a negative bias in trends calculated from summer roost counts, so these data are omitted (Dambly et al., 2021).
For each species, Generalised Additive Modelling (GAM) is used to calculate the trends in numbers over time (Fewster et al., 2000). The models include terms for factors that can influence the apparent population averages (for example, bat detector model, temperature), so their effect can be taken into account. The GAM models produce smoothed trends which are more robust against random variation between years. For easier interpretation the means are then converted to an index that is set to 100 for the selected baseline year of data. The species indices are revised when new data become available or when improved modelling methods are developed and applied retrospectively to data from earlier years. As such, indices published in previous years are not strictly comparable to the current index.
To generate the composite bat indicator and confidence intervals, each species has been given equal weighting, and the annual index figure is the geometric mean in that year (Figure 1). Confidence intervals are relatively wide due to the high variability inherent in bat monitoring data and the rarity of several species. Change is assessed using the 95% confidence intervals fitted to the trend. If the confidence intervals include zero, the trend is considered to show no meaningful change. If the confidence intervals do not include zero, the trend is assessed as either increasing or decreasing, depending on its direction. Long- and short-term assessments are made in comparison to the penultimate year of the trend as the most recent year’s smoothed data point is likely to change as future years of data are added. The survey methods and statistical analysis used by the NBMP to produce individual species trends are described in Barlow et al., (2015).
The collection of data from bat hibernation surveys was suspended in winter 2020/21 due to the COVID-19 pandemic. As a result, the 2021 index value has been estimated using imputed hibernation survey data for that year.
Table 1: Long-term and short-term percentage change in the species trends used in the bat indicator
| Species group | Long-term time frame | Long-term change | Long-term significance of change | Short-term time frame | Short-term change | Short-term significance of change |
|---|---|---|---|---|---|---|
| serotine (Eptesicus serotinus) | 1999-2023 | 11.3 | Not significant | 2018-2023 | 15.5 | Significant increase |
| Daubentons bat (Myotis daubentonii) | 1999-2023 | 13.1 | Not significant | 2018-2023 | -0.7 | Not significant |
| Natterers bat (Myotis nattereri) | 2002-2023 | 42.1 | Significant increase | 2018-2023 | 2.4 | Not significant |
| whiskered/Brandts bat (Myotis mystacinus/brandtii) | 1999-2023 | 25.7 | Not significant | 2018-2023 | -0.3 | Not significant |
| noctule (Nyctalus noctula) | 1999-2023 | 30.5 | Not significant | 2018-2023 | 5.0 | Not significant |
| common pipistrelle (Pipistrellus pipistrellus) | 1999-2023 | 86.8 | Significant increase | 2018-2023 | 1.2 | Not significant |
| soprano pipistrelle (Pipistrellus pygmaeus) | 1999-2023 | 61.5 | Significant increase | 2018-2023 | 23.8 | Not significant |
| brown long-eared bat (Plecotus auritus) | 2001-2023 | 3.5 | Not significant | 2018-2023 | -1.2 | Not significant |
| lesser horseshoe bat (Rhinolophus hipposideros) | 1999-2023 | 125.0 | Significant increase | 2018-2023 | 8.6 | Significant increase |
| greater horseshoe bat (Rhinolophus ferrumequinum) | 1999-2023 | 231.6 | Significant increase | 2018-2023 | 17.0 | Significant increase |
Source: Bat Conservation Trust
Note about Table 1
- To better capture patterns in the data, long-term and short-term assessments are made on the basis of smoothed data, with analysis of the underlying trend undertaken by Bat Conservation Trust. All 11 species are protected through Annex IV of the Habitats Directive. Greater horseshoe bat and lesser horseshoe bat are also listed on Annex II of the Directive – leading to Special Areas of Conservation being designated for these species.
Background
Bat populations are believed to have undergone major declines throughout Western Europe before and during the 20th century, which have been attributed to persecution, agricultural intensification, habitat and roost loss, remedial timber treatment and declines of their insect prey. Evidence of these declines (synthesised in Haysom et al., 2010) is fragmented as during this period few data were collected in a systematic way. Evidence includes:
- Well documented range contractions of greater horseshoe bat and lesser horseshoe bat across Great Britain and Europe.
- Analysis of genomic data to identify historic population declines (Razgour et al., 2024).
- Reports of the loss of large colonies of several species from traditional roosting sites.
- Reductions in the number of known maternity colonies across Great Britain.
- A small number of published population trends (for example, Ransome, 1989 and Guest et al., 2002).
The bat index suggests that more recently some GB bat populations are beginning to recover. The greatest weight of evidence suggests two factors have had a positive impact on bat populations in Great Britain; a reduction in human disturbance since the introduction of strict legal protection, and a milder climate (Burns et al., 2016). Climate changes over winter and spring have been shown to benefit horseshoe bat species (Battersby, 2005; Froidevaux et al., 2017; Schofield, 2008). The impact of climate change on other British bat species is less clear.
Bats have also benefited from direct conservation action and public education (Mitchell-Jones 1993; Haysom et al., 2010), but remain vulnerable to pressures such as landscape change, climate change, development, wind turbines, and light pollution (Browning et al., 2021; Haysom et al., 2010; Kunz et al., 2007; Rebelo et al., 2010; Stone et al., 2009, 2012).
Development plan
Since our previous publication we have adapted the language and visualisations used in this indicator. We are keen to hear from our users about these changes, as well as our published development plan, please email us.
References
- Barlow, K. E., Briggs, P. A., Haysom, K. A., Hutson, A. M., Lechiara, N. L., Racey, P. A., Walsh, A. L. and Langton, S. D. (2015). Citizen science reveals trends in bat populations: the National Bat Monitoring Programme in Great Britain. Biological Conservation, 182, pp. 14 to 26.
- Battersby, J. (2005). UK Mammals: Species Status and Population Trends. First Report by the Tracking Mammals Partnership. Peterborough, UK.
- Browning, E., Barlow, K.E., Burns, F., Hawkins, C., Boughey, K. (2021), Drivers of European bat population change: a review reveals evidence gaps. Mammal Review, 51, pp. 353 to 368.
- Burns F, Eaton M. A., Barlow K. E., Beckmann B. C., Brereton T., Brooks D. R., Brown P. M. J., Al Fulaij A., Gent T., Henderson I., Noble D. G., Parsons M., Powney G. D., Gregory R. D. (2016) Agricultural Management and Climatic Change Are the Major Drivers of Biodiversity Change in the UK. PLoS ONE 11(3): e0151595. https://doi.org/10.1371/journal.pone.0151595.
- Dambly, L.I., Jones, K.E., Boughey, K.L., Isaac, N.J.B. (2021). Observer retention, site selection and population dynamics interact to bias abundance trends in bats. Journal of Applied Ecology, 58, pp. 236 to 247.
- Fewster, R. M., Buckland, S. T., Siriwardena, G. M., Baillie, S. R. and Wilson, J. D. (2000). Analysis of population trends for farmland birds using generalized additive models. Ecology, 81, pp. 1970 to 1984.
- Froidevaux J. S. P., Boughey K. L., Barlow K. E., Jones G. (2017). Factors driving population recovery of the greater horseshoe bat (Rhinolophus ferrumequinum) in the UK: implications for conservation. Biodiversity and Conservation, 26, pp. 1 to 21.
- Guest, P., Jones, K. E. and Tovey, J. (2002). Bats in Greater London: unique evidence of a decline over 15 years. British Wildlife, 13, pp. 1 to 5.
- Haysom, K. A., Jones, G., Merrett, D. and Racey, P. A. (2010). Bats. pp. 259 to 280 in: Maclean N (ed.) Silent Summer: The State of Wildlife in Britain and Ireland. Cambridge University Press.
- Jones, G., Jacobs, D. S., Kunz, T. H., Willig, M. R., Racey, P. A. (2009). Carpe noctem: the importance of bats as bioindicators. Endangered Species Research, 8, pp. 93 to 115.
- Kunz, T. H., Arnett, E. B., Erickson, W. P., Hoar, A. R., Johnson, G. D., Larkin, R. P., Strickland, M. D., Thresher, R. W. and Tuttle, M. D. (2007). Ecological impacts of wind energy development on bats: questions, research needs, and hypotheses. Frontiers in Ecology and the Environment, 5, pp. 315 to 324.
- Mitchell-Jones, A. J. (1993). The growth and development of bat conservation in Britain. Mammal Review, 23, pp. 139 to 148.
- Ransome, R.D. (1989). Population changes of Greater horseshoe bats studied near Bristol over the past twenty-six years. Biological Journal of the Linnean Society, 38, 71 to 82.
- Razgour, O., Montauban, C., Festa, F., Whitby, D., Juste, J., Ibáñez, C., Rebelo, H., Afonso, S., Bekaert, M., Jones, G., Williams, C., & Boughey, K. (2024). Applying genomic approaches to identify historic population declines in European forest bats. Journal of Applied Ecology, 61, 160–172.
- Rebelo, H., Tarroso, P. & Jones, G. (2010). Predicted impact of climate change on European bats in relation to their biogeographic patterns. Global Change Biology, 16(2), 561 to 576.
- Schofield, H. (2008). The Lesser Horseshoe Bat Conservation Handbook. Vincent Wildlife Trust, Herefordshire.
- Stone, E.L., Jones, G. & Harris, S. (2009). Street lighting disturbs commuting bats. Current Biology, 19, 1123 to 1127.
- Stone, E.L., Jones, G. & Harris, S. (2012). Conserving energy at a cost to biodiversity? Impacts of LED lighting on bats. Global Change Biology, 18, 2458 to 2465.
Categories:
Published: