Insects of the wider countryside (butterflies)
Last updated: 2025
Latest data available: 2024
Introduction
This indicator covers three measures of annual butterfly population abundance in the UK. First, we analyse all-species of butterflies, which is further divided into indicators for ‘habitat specialists’ and ‘generalist species’ of butterflies. There are also individual indicators for ‘farmland butterflies’ and ‘woodland butterflies’. These measures are also divided into indicators for habitat specialists and generalist species of butterflies.
Butterflies are complementary to birds and bats as an indicator, especially the habitat specialists, because they use resources in the landscape at a much finer spatial scale than either birds or bats.
Throughout this indicator, you should be aware that two species are counted as one. This is because an aggregate trend is used for the small skipper (Thymelicus lineola) and Essex skipper (Thymelicus sylvestris). These two species have been combined due to historical difficulties in distinguishing between them in the field.
Data for this indicator can be found in the published datafile. We also have a similar indicator at the England level. For more detailed information, including individual species trends, see the Butterflies in the United Kingdom and in England statistical release.
Type of indicator
State indicator
Type of official statistics
Accredited official statistic
![]()
Contents
- Assessment of change
-
Key results
- All-species of resident butterflies
- Figure 1: Trends for the abundance of all-species of butterflies resident in the UK (50 species), 1976 to 2024
- Figure 2: Long-term and short-term changes in individual species trends for all-species of butterflies in the UK (50 species), 1976 to 2024
- Figure 3: Trends for the abundance of habitat specialist (26 species) and generalist butterfly species (24 species) in the UK, 1976 to 2024
- Figure 4: Long-term and short-term changes in individual species trends for habitat specialist (26 species) and generalist (24 species) butterflies in the UK, 1976 to 2024
- Farmland butterflies
- Figure 5: Trends for the abundance of generalist and specialist farmland butterflies in the UK (44 species), 1990 to 2024
- Figure 6: Long-term and short-term changes in individual species trends for generalist and specialist farmland butterflies in the UK (44 species), 1990 to 2024
- Woodland butterflies
- Figure 7: Trends for the abundance of generalist and specialist woodland butterflies in the UK (39 species), 1990 to 2024
- Figure 8: Long-term and short-term changes in individual species trends for generalist and specialist woodland butterflies in the UK (39 species), 1990 to 2024
- Further detail
- Acknowledgements
- Technical annex
- References
Assessment of change
Assessment of change in butterfly populations:
| Measure | Assessment | Time period | Result |
|---|---|---|---|
| All-species | Long term | 1976 to 2024 | Deteriorating |
| All-species | Short term | 2014 to 2024 | Deteriorating |
| Habitat specialist butterflies | Long term | 1990 to 2024 | Deteriorating |
| Habitat specialist butterflies | Short term | 2014 to 2024 | Little or no overall change |
| Generalist butterflies | Long term | 1990 to 2024 | Little or no overall change |
| Generalist butterflies | Short term | 2014 to 2024 | Little or no overall change |
| Farmland specialist butterflies | Long term | 1990 to 2024 | Deteriorating |
| Farmland specialist butterflies | Short term | 2014 to 2024 | Deteriorating |
| Woodland specialist butterflies | Long term | 1990 to 2024 | Deteriorating |
| Woodland specialist butterflies | Short term | 2014 to 2024 | Deteriorating |
Notes on the indicator assessment
- Long-term and short-term assessments of the statistical significance of these changes are made using the smoothed data to 2024. Analysis of the underlying trends is performed by the data providers.
Key results
-
The index of all-species butterfly abundance in the UK has declined over the long term by 18%. Over the short term (since 2014), butterfly abundance in the UK decreased by 4%.
-
Over the long term (1976 to 2024), habitat specialist butterflies have deteriorated by 39% in the UK. Over the short term, the abundance of habitat specialist butterflies in the UK didn’t change significantly.
-
The generalist butterfly index for the UK has not changed over the long- or short-term.
-
The abundance of butterflies in woodland showed a greater decline than farmland butterflies over the long term (1990 to 2024) in the UK. Woodland butterflies declined by 54% whereas farmland butterflies fell by 32%. In contrast, farmland butterflies have declined in the short term (2014 to 2024) by 12% whereas woodland butterflies have shown no significant change over the same time period.
All-species of resident butterflies
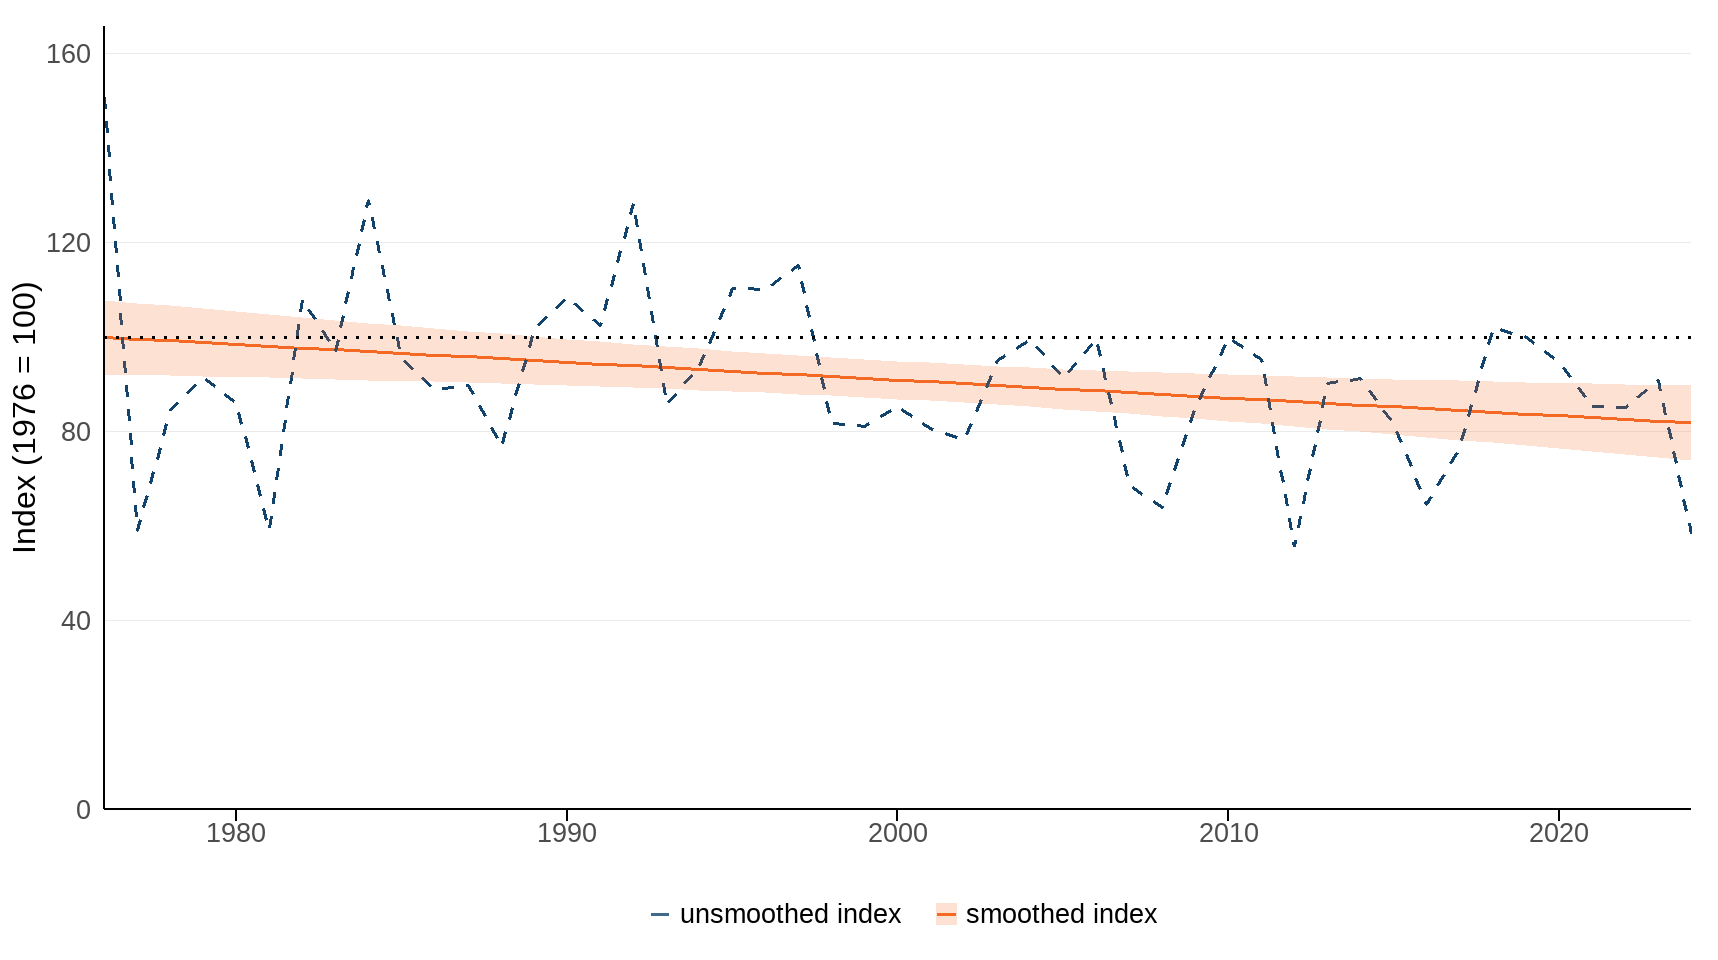
Over the long term (1976 to 2024), the all-species index for the UK declined by 18%. Over the short term (since 2014), butterfly abundance in the UK decreased by 4% (Figure 1).
Although May was the warmest on record, it was accompanied by notably low levels of sunshine — particularly in Wales and Northern Ireland, which experienced some of their dullest conditions since records began. Overall, 2024 ranked as the UK’s fourth warmest and eighth wettest year since the early 1900s — a combination of factors that can disrupt seasonal patterns essential to many butterfly species.
Figure 1: Trends for the abundance of all-species of butterflies resident in the UK (50 species), 1976 to 2024
Source: Butterfly Conservation, UK Centre for Ecology & Hydrology, Defra, British Trust for Ornithology, Joint Nature Conservation Committee.
Note about Figure 1
- The smoothed index is presented together with the 95% confidence interval (a measure of uncertainty) represented by the shaded area around the trend line.
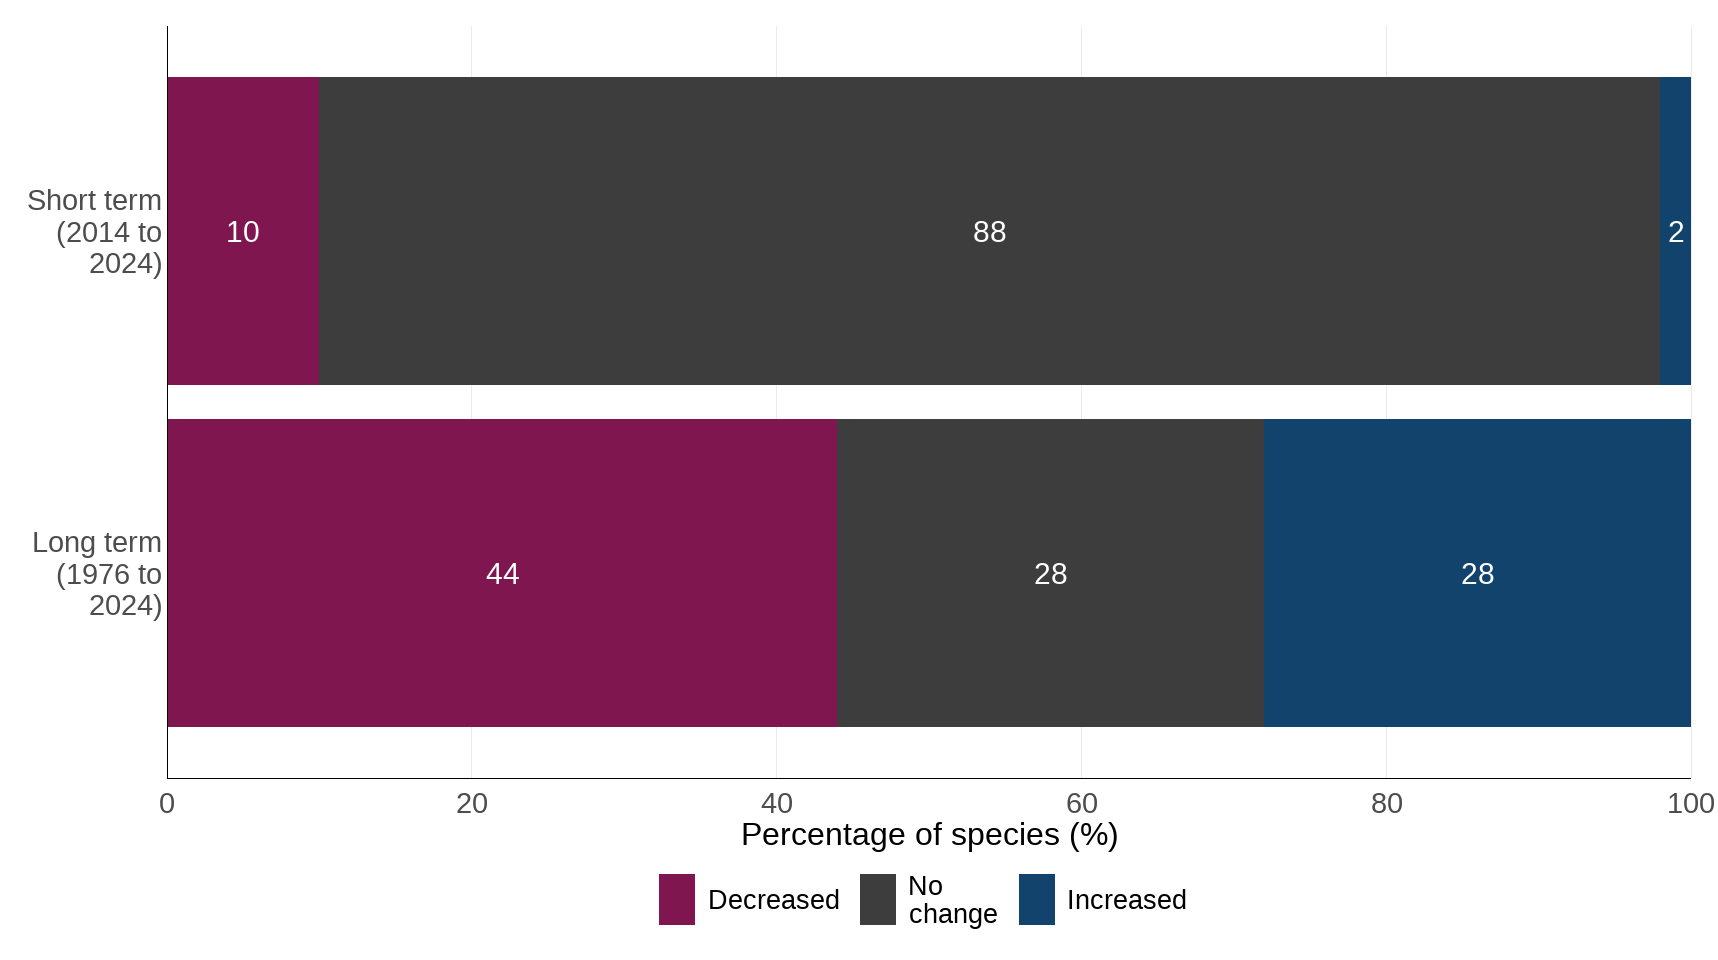
Figure 2: Long-term and short-term changes in individual species trends for all-species of butterflies in the UK (50 species), 1976 to 2024
Source: Butterfly Conservation, UK Centre for Ecology & Hydrology, Defra, British Trust for Ornithology, Joint Nature Conservation Committee.
Notes about Figure 2
- The bar chart above shows the percentage of species within the indicator that have increased, decreased or shown no change in abundance over the long-term and short-term assessment periods.
- Totals may not add up to 100 percent due to rounding.
The all-species index can be further divided into groupings for ‘habitat specialists’ and ‘generalist’ butterfly species.
Habitat breakdown
Habitat specialist butterflies are restricted to particular habitats such as flower-rich grassland, heathland and woodland clearings. They are vulnerable to habitat loss and fragmentation and many have not recovered from declines experienced in the late 1970s. Some of these early declines are likely to be at least partly a result of the knock-on effects of the drought conditions experienced in 1976 but the lack of suitable habitat thereafter is regarded to be the main driver behind the persistent decline and lack of recovery.
Generalist butterfly species can breed in a range of habitats across the countryside landscape and in more urbanised areas.
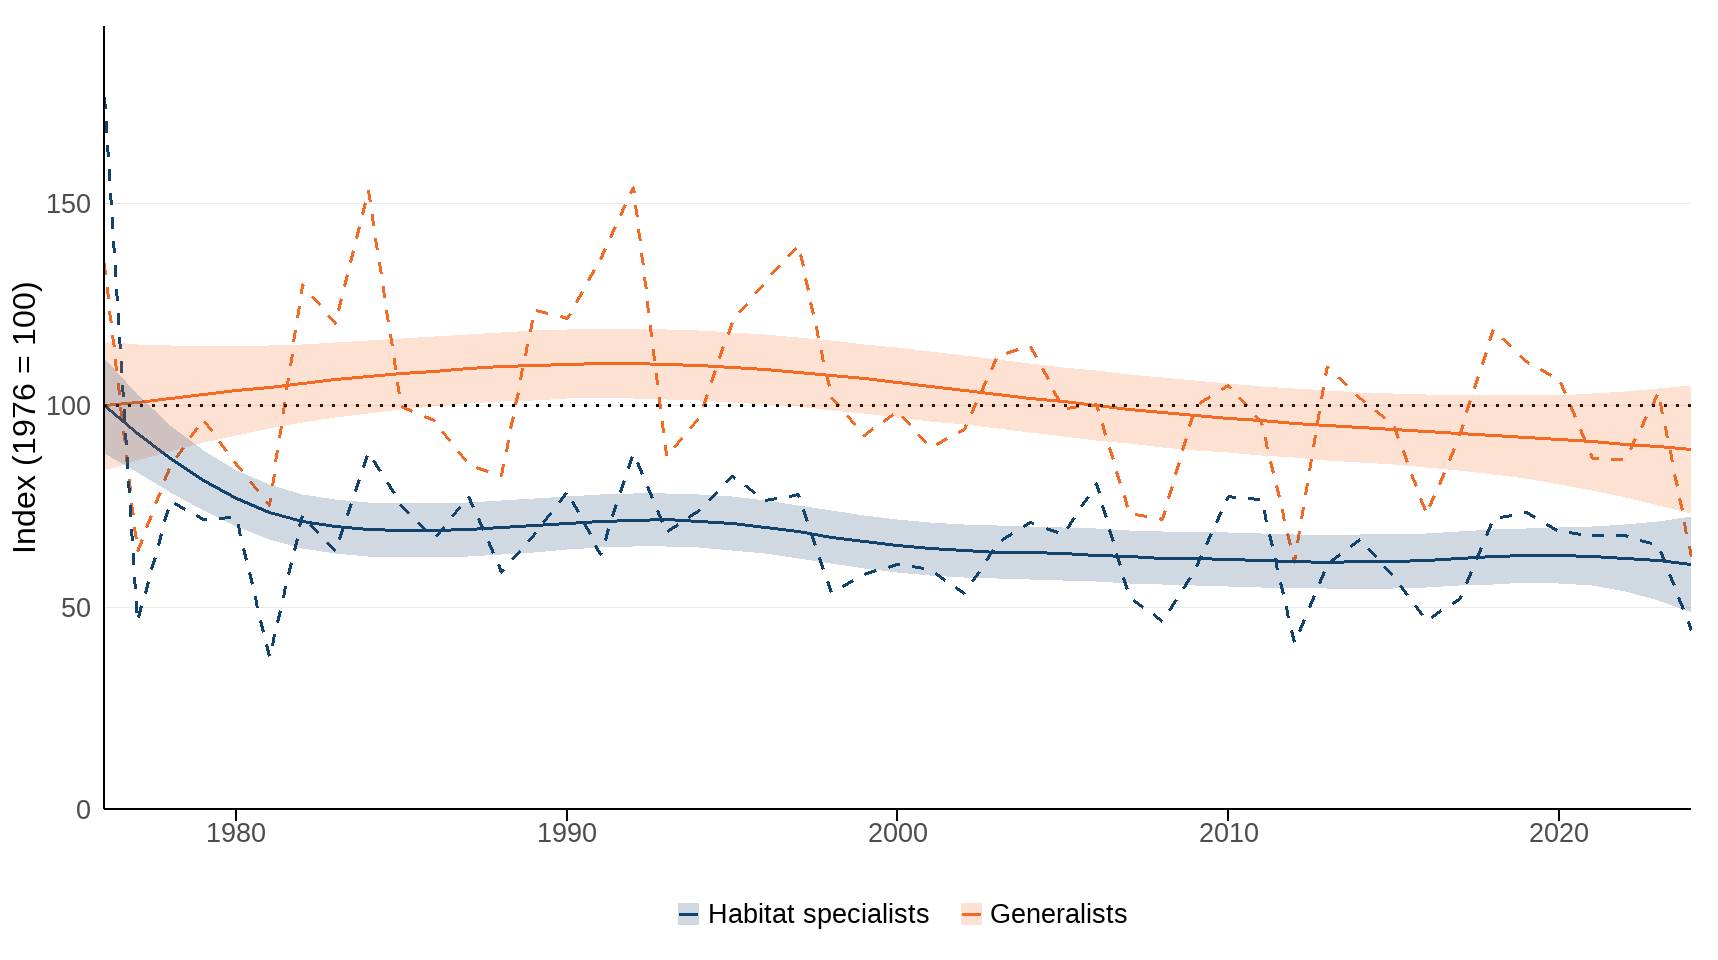
Habitat specialist butterflies have fared worse than generalist species in the UK. The abundance of generalist species has not changed over both the long term and short term. In contrast, habitat specialists have declined by 39% in the UK over the long term (1976 to 2024), while showing little change in the short term (2014 to 2024) (see Figure 3).
Figure 3: Trends for the abundance of habitat specialist (26 species) and generalist butterfly species (24 species) in the UK, 1976 to 2024
Source: Butterfly Conservation, UK Centre for Ecology & Hydrology, Defra, British Trust for Ornithology, Joint Nature Conservation Committee.
Note about Figure 3
- The smoothed index is presented together with the 95% confidence interval (a measure of uncertainty) represented by the shaded area around the trend line.
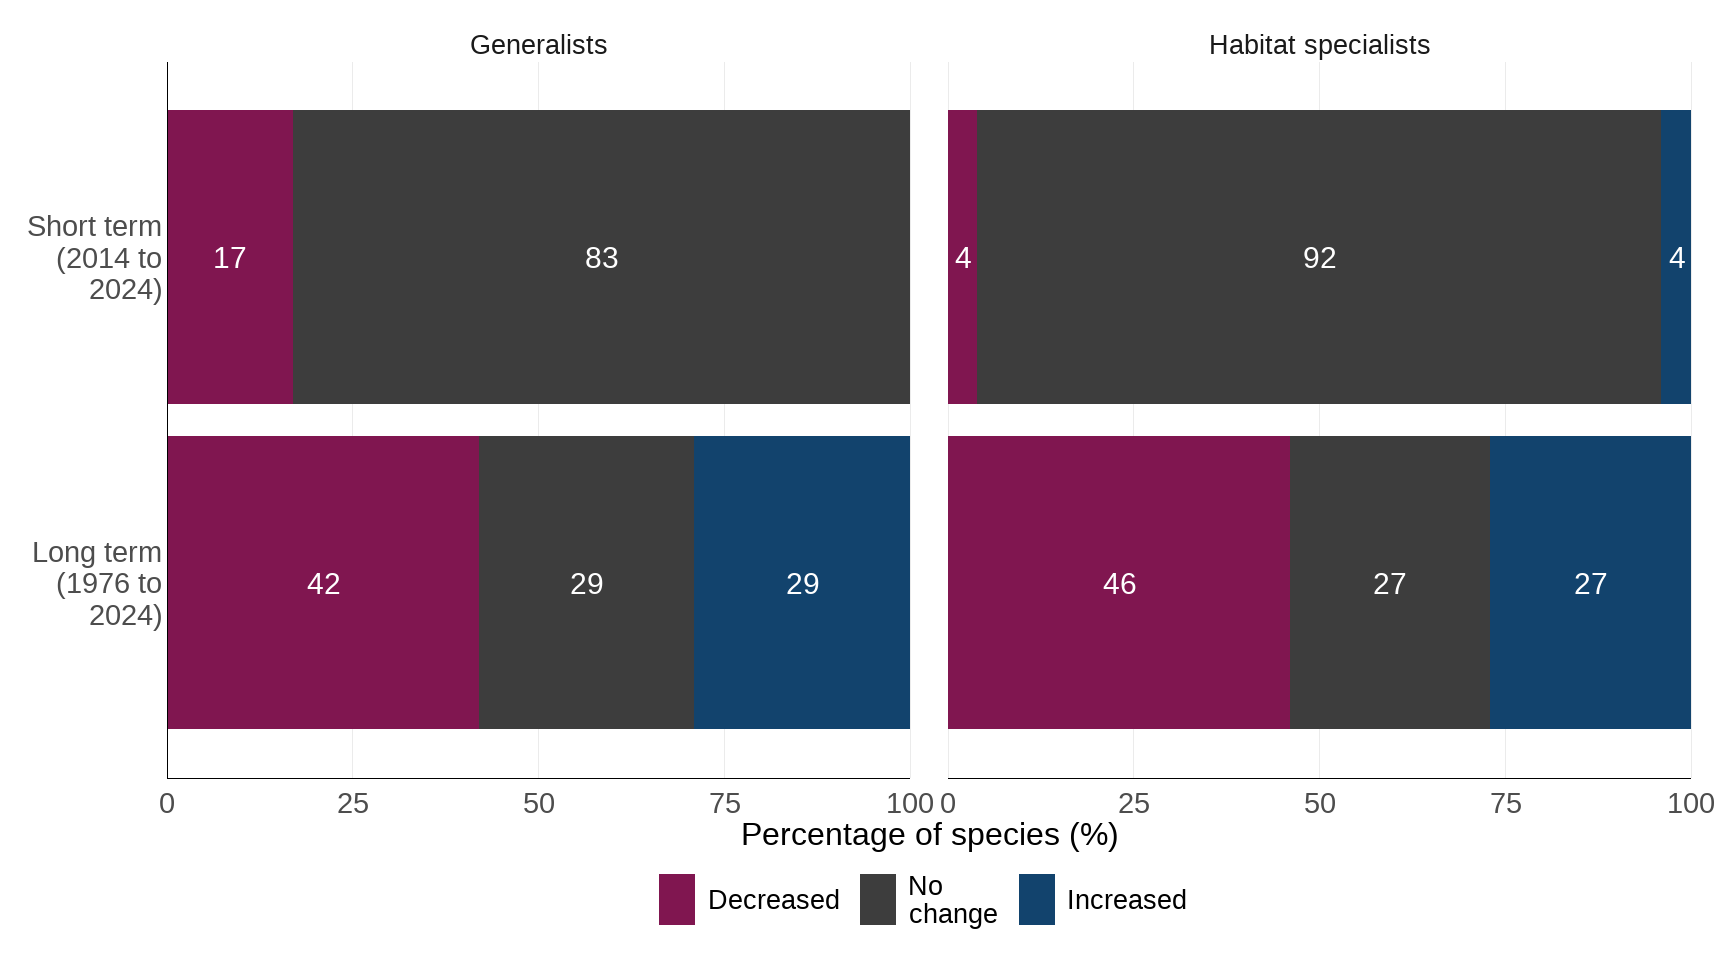
Figure 4: Long-term and short-term changes in individual species trends for habitat specialist (26 species) and generalist (24 species) butterflies in the UK, 1976 to 2024
Source: Butterfly Conservation, UK Centre for Ecology & Hydrology, Defra, British Trust for Ornithology, Joint Nature Conservation Committee.
Notes about Figure 4
- The bar chart above shows the percentage of species within the indicator that have increased, decreased or shown no change in abundance over the long-term and short-term assessment periods.
- Totals may not add up to 100 percent due to rounding.
For detailed information, including individual species trends, see the ‘all-species’ section in the Butterflies in the United Kingdom and in England.
Farmland butterflies
In the UK, farmland habitat specialist butterflies have fared worse than farmland generalist butterflies, which require less reliance on specific habitats. Each species has individual and regional circumstances, however, the main causes for decline in farmland habitat specialists are the loss, fragmentation and degradation of their habitats, with agricultural intensification also contributing.
The abundance of farmland habitat specialist butterflies, over the long term has declined in the UK by 42%. Over the short-term period (2014 to 2024) their abundance has continued to decrease by 15% (Figure 5).
Over the long term (since 1990), the abundance of farmland generalists has also declined in the UK by 21%. Over the short term (2014 to 2024) they have decreased by 7% in the UK (Figure 5).
Figure 5: Trends for the abundance of generalist and specialist farmland butterflies in the UK (44 species), 1990 to 2024
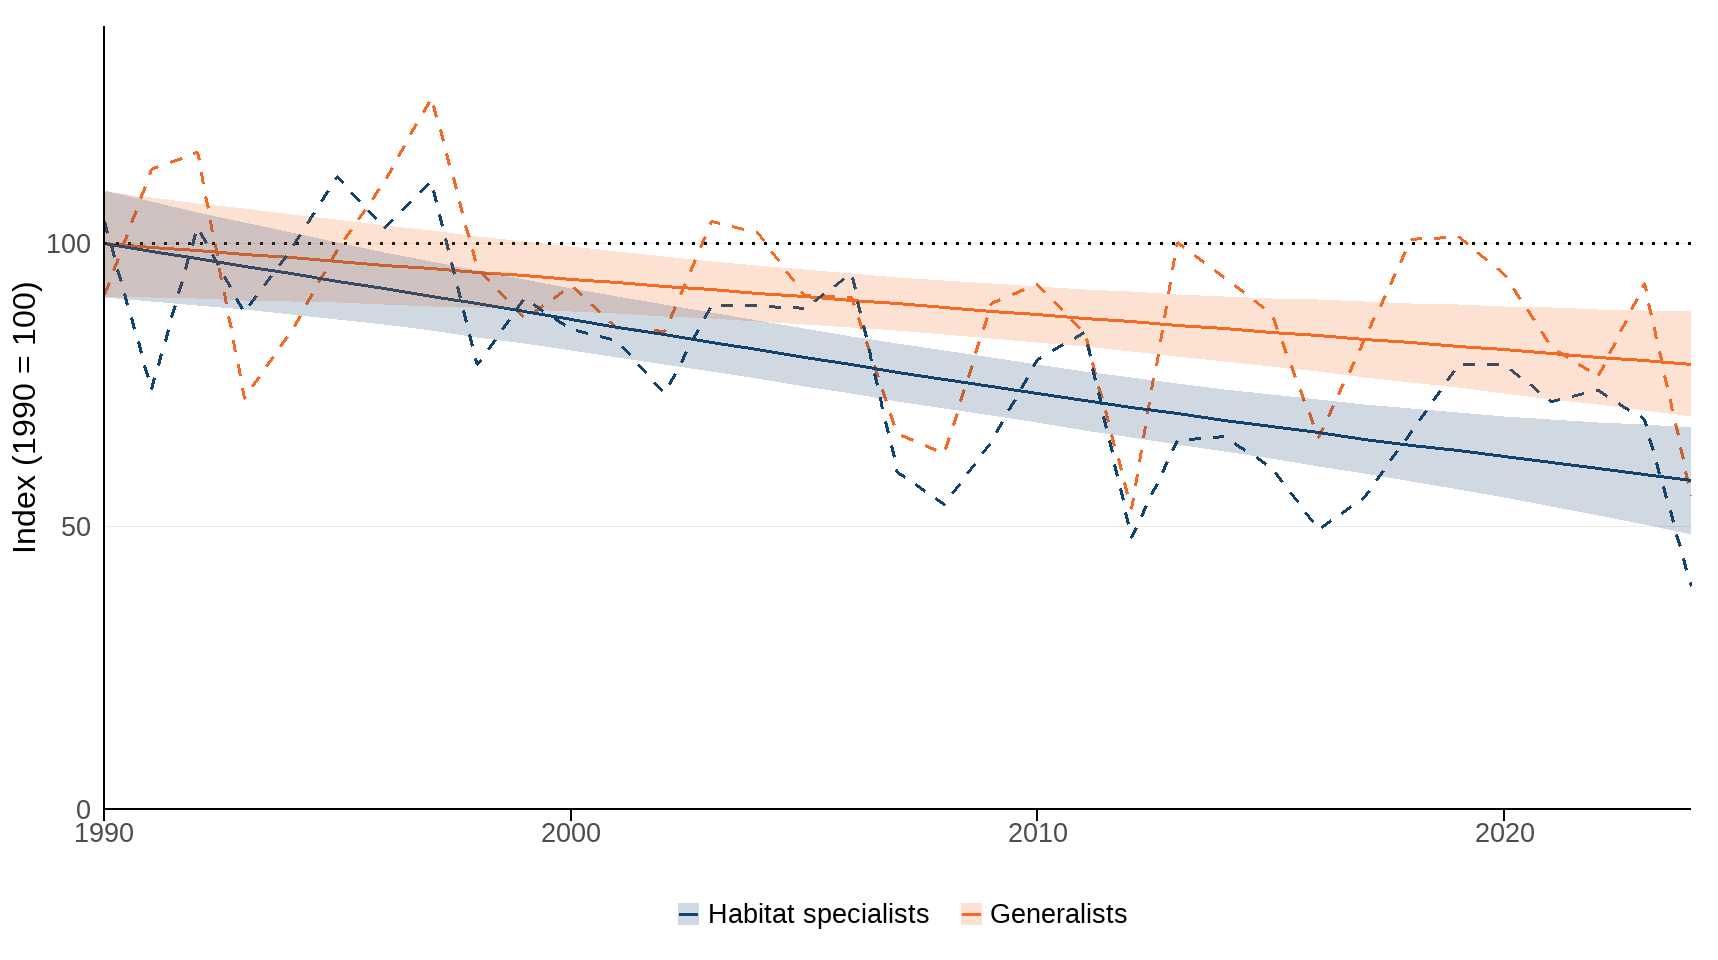
Source: Butterfly Conservation, UK Centre for Ecology & Hydrology, Defra, British Trust for Ornithology, Joint Nature Conservation Committee.
Note about Figure 5
- The smoothed index is presented together with the 95% confidence interval (a measure of uncertainty) represented by the shaded area around the trend line.
Figure 6: Long-term and short-term changes in individual species trends for generalist and specialist farmland butterflies in the UK (44 species), 1990 to 2024
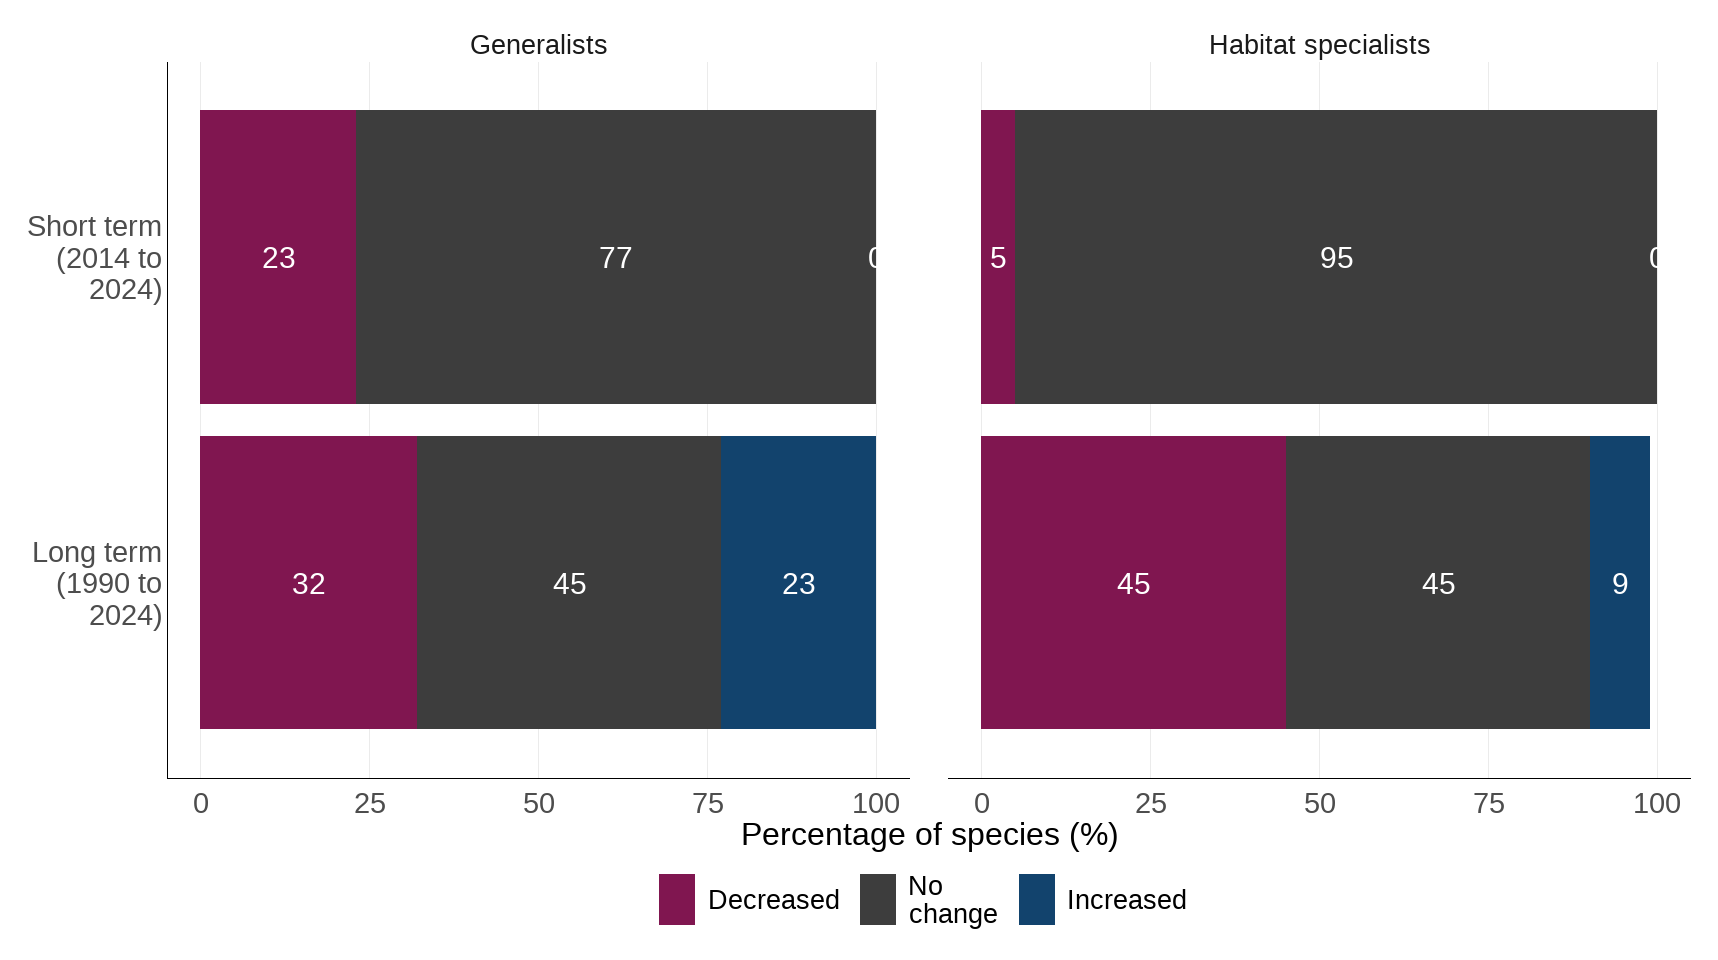
Source: Butterfly Conservation, UK Centre for Ecology & Hydrology, Defra, British Trust for Ornithology, Joint Nature Conservation Committee.
Notes about Figure 6
- The bar chart above shows the percentage of species within the indicator that have increased, decreased or shown no change in abundance over the long-term and short-term assessment periods.
- Totals may not add up to 100 percent due to rounding.
For detailed information, including individual species trends, see the ‘farmland butterflies’ section in the Butterflies in the United Kingdom and in England.
Woodland butterflies
In UK woodland, woodland habitat specialist butterflies fared worse than the woodland generalists, which require less reliance on specific habitats. Each species has individual and regional circumstances, however, the main causes for decline in woodland habitat specialists are the loss, fragmentation and degradation of their habitats, with the decline of traditional woodland management practices also contributing.
The abundance of woodland habitat specialist species, over the long term, in the UK declined by 55%. Over the short-term period (2014 to 2024), woodland habitat specialists in the UK continued to decline by 26% (Figure 7).
Over the long term (1990 to 2024), the abundance of woodland generalist species in the UK has declined by 52%. Over the short term (2014 to 2024), the abundance of woodland generalists has not changed (Figure 7).
Figure 7: Trends for the abundance of generalist and specialist woodland butterflies in the UK (39 species), 1990 to 2024
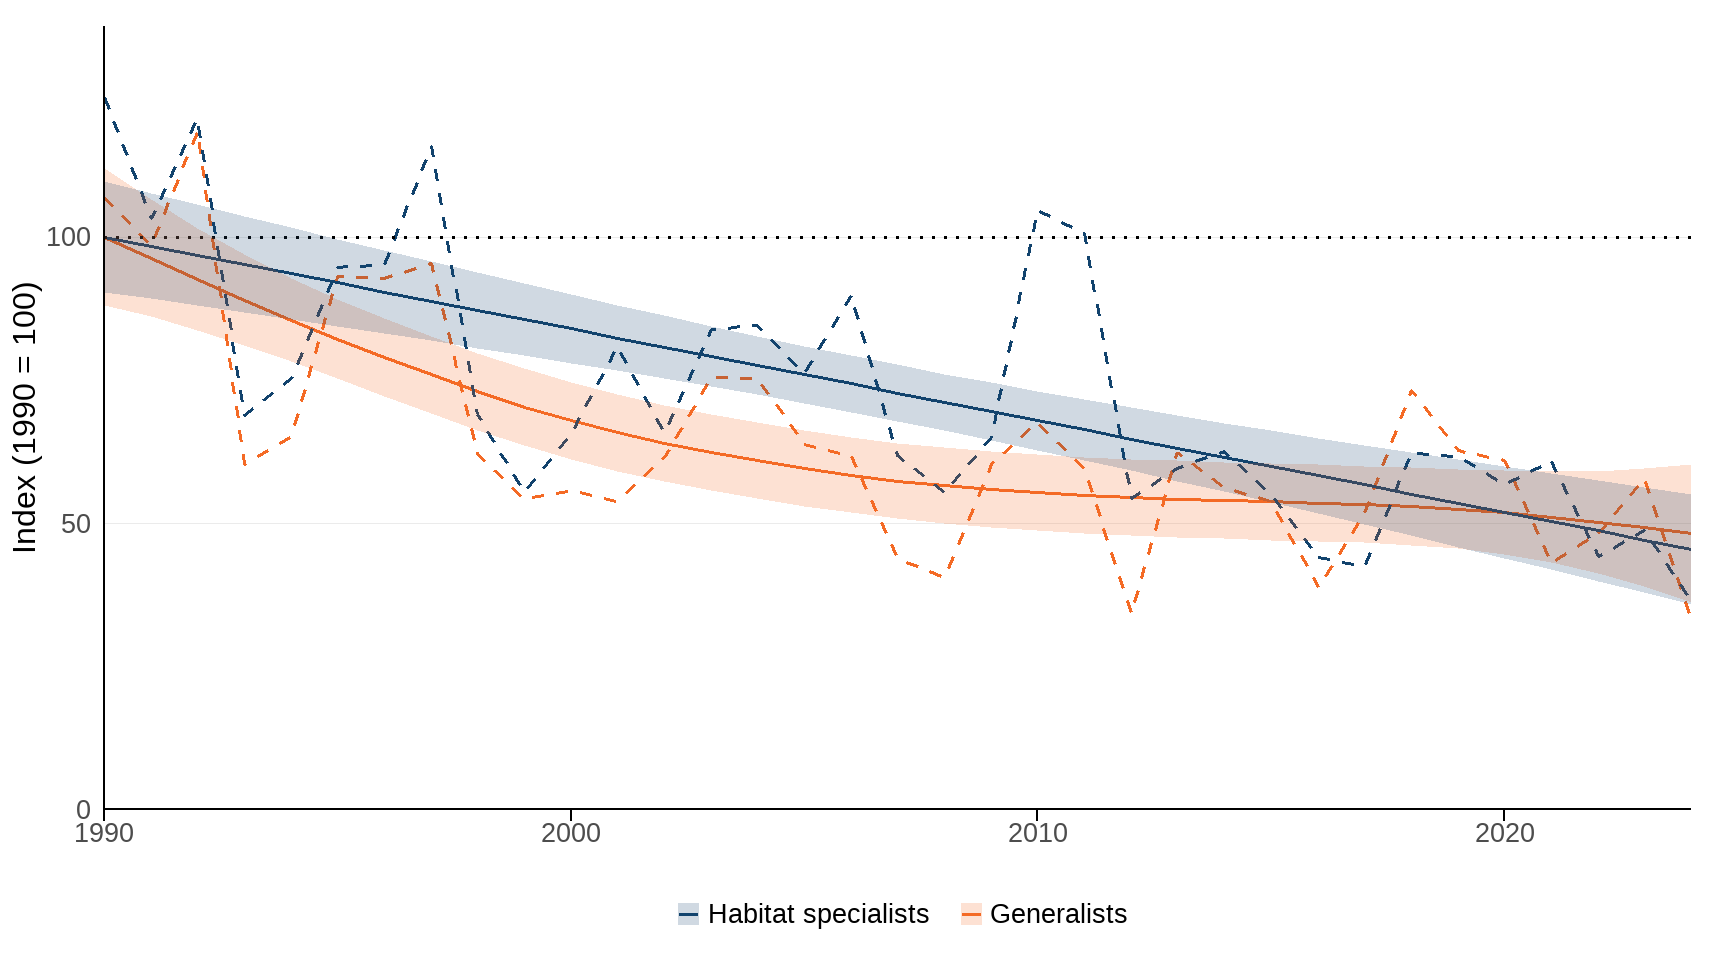
Source: Butterfly Conservation, UK Centre for Ecology & Hydrology, Defra, British Trust for Ornithology, Joint Nature Conservation Committee.
Note about Figure 7
- The smoothed index is presented together with the 95% confidence interval (a measure of uncertainty) represented by the shaded area around the trend line.
Figure 8: Long-term and short-term changes in individual species trends for generalist and specialist woodland butterflies in the UK (39 species), 1990 to 2024
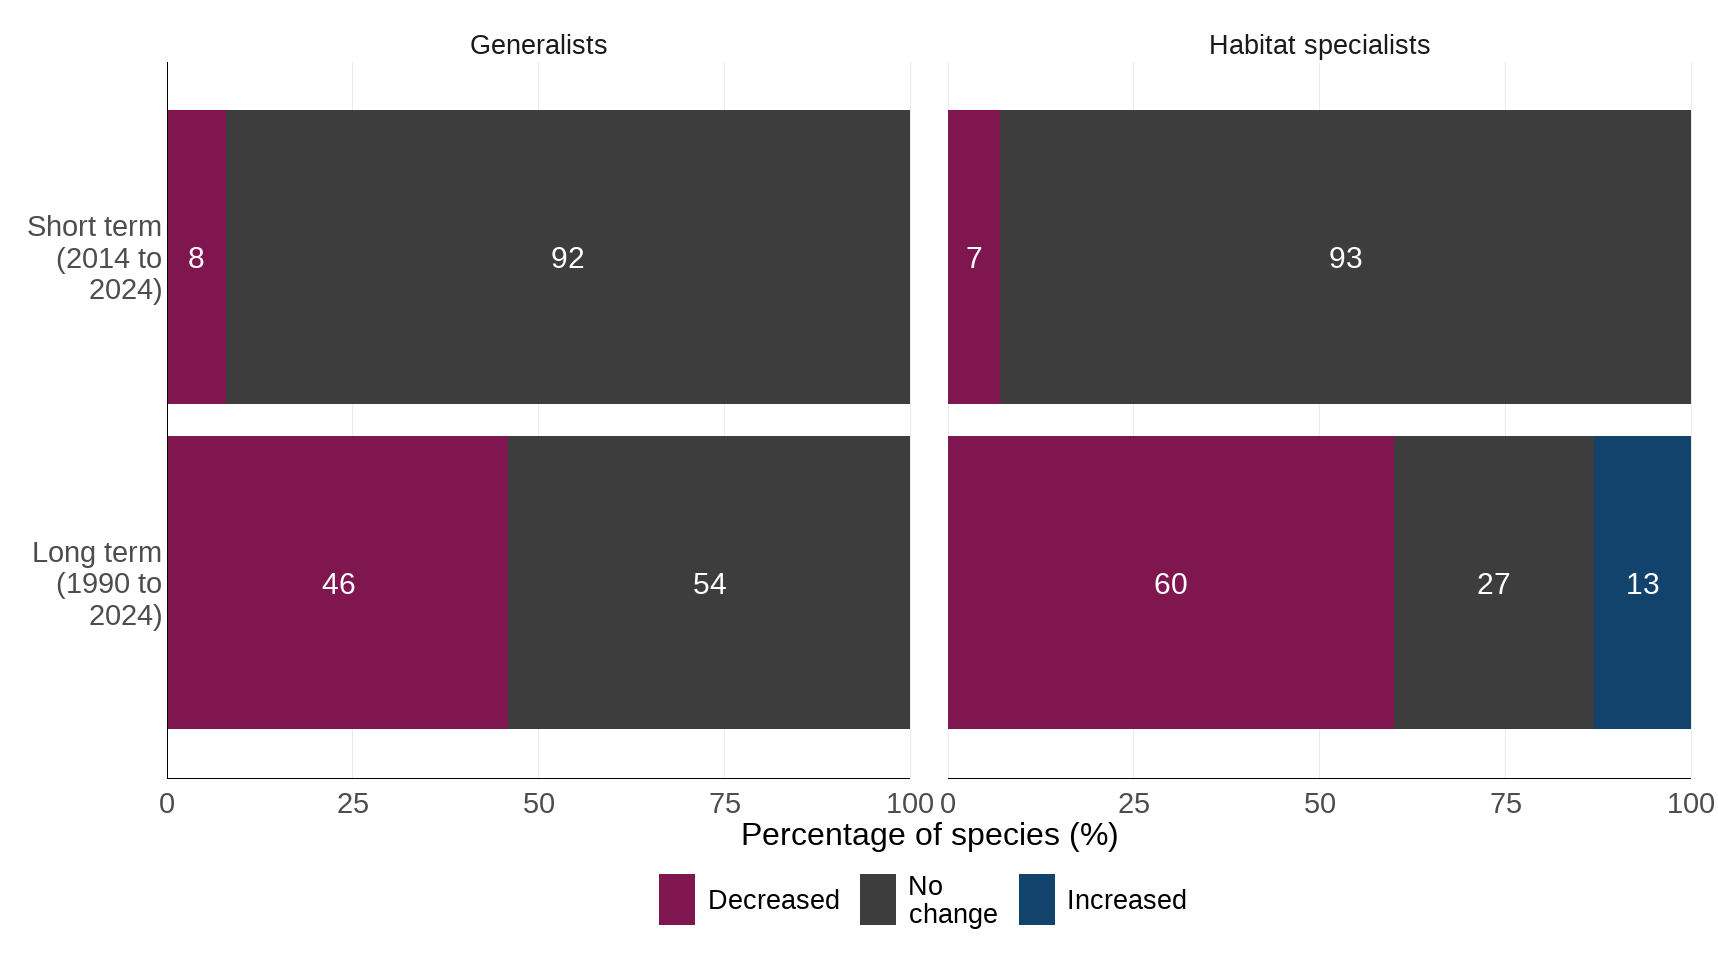
Source: Butterfly Conservation, UK Centre for Ecology & Hydrology, Defra, British Trust for Ornithology, Joint Nature Conservation Committee.
Notes about Figure 8
- The bar chart above shows the percentage of species within the indicator that have increased, decreased or shown no change in abundance over the long-term and short-term assessment periods.
- Totals may not add up to 100 percent due to rounding.
For detailed information, including individual species trends, see the ‘woodland butterflies’ section in the Butterflies in the United Kingdom and in England.
Further detail
Relevance
Butterflies are considered to provide a good indication of the broad state of the environment because they respond rapidly to changes in environmental conditions and habitat management, occur in a wide range of habitats, and are representative of many other insects, in that they utilise areas with abundant plant food resources. Butterflies are complementary to birds and bats as indicator species, especially the habitat specialists, because they use resources in the landscape at a much finer spatial scale than either birds or bats. There are also long-term data available on changes in populations of butterflies which help in the interpretation of shorter-term fluctuations.
International/domestic reporting
The suite of UK Biodiversity Indicators has been revised and updated to bring it in line with the Kunming-Montreal Global Biodiversity Framework (GBF) of the Convention on Biological Diversity (CBD). Some UKBIs will be used for the forthcoming UK national reports to CBD.
Web links for further information
-
The State of UK’s Butterflies in 2022 is available on the UKBMS website
-
Further information about the UK Butterfly Monitoring Scheme is available on the UKBMS website
-
Further information about the state of Britain’s butterflies can be found on the Butterfly Conservation website
Acknowledgements
Thank you to all citizen scientists contributing data to the UK Butterfly Monitoring Scheme and to, Butterfly Conservation, UK Centre for Ecology and Hydrology and the UKBMS who provide the data.
Technical annex
Background
All data are compiled by Butterfly Conservation (BC) and the UK Centre for Ecology & Hydrology (UKCEH) from data collated through the UK Butterfly Monitoring Scheme (UKBMS) including from the Wider Countryside Butterfly Survey (WCBS).
The annual ‘all-species’ index is compiled for butterflies that are resident in the UK. The UK ‘all-species’ index includes 50 resident species out of the 58 regularly occurring species of butterflies (26 habitat specialists and 24 generalist species). Data for the UK ‘all-species’ index uses data collected at 7,217 locations across the UK. The resident species do not include regular migrant species or rarer species with less complete data runs as this would not be representative.
The ‘habitat specialists’ and ‘generalist species of butterflies’ in the UK indicators include individual measures for 26 habitat specialist butterflies (low mobility species restricted to semi-natural habitats) and 24 generalist species of butterflies (which use both semi-natural and general countryside habitats). It uses butterfly count data collected at 7,217 sample locations across the UK – 4,839 UKBMS butterfly transect and reduced effort sites and 2,378 randomly selected 1-kilometre squares of the WCBS (see the interactive map through the UKBMS sites details map).
The two habitat indices include 44 species surveyed on UK farmland and 39 species in UK woodland. The two habitat-specific measures for the UK are ‘farmland butterflies’, and ‘woodland butterflies’. Each habitat measure is split into ‘habitat specialists’ or ‘generalist species’ of butterflies. It uses butterfly count data collected at UKBMS butterfly transect sites on farmland and in woodland, along with additional data from randomly selected 1-kilometre squares of the WCBS, primarily comprised of farmland and woodland in the UK. This totals 5,168 farmland sites in the UK and 3,847 woodland sample locations in the UK. See the interactive map through the UKBMS sites details map. The base year for the two habitat indices is 1990 rather than 1976. This is because prior to this date, the data for these two indices is not considered to be representative at this scale of farmland and woodland in the UK.
For all the indices presented an aggregate trend is used for small skipper (Thymelicus lineola) and Essex skipper (Thymelicus sylvestris). These two species have been combined due to historical difficulties with distinguishing between them in the field.
UKCEH, who are part of the UKBMS are currently exploring how to improve the dataset regarding regional and habitat biases. The aim is to improve the quality of the data and better represent numbers of butterflies.
Further details of the methods used can be found on the UKBMS website.
Methodology
Data collection
The core indicator is comprised of multi-species indices compiled by Butterfly Conservation and the UK Centre for Ecology and Hydrology (UKCEH) from data collated through the UK Butterfly Monitoring Scheme (UKBMS) including the Wider Countryside Butterfly Survey (WCBS). Through the UKBMS, data are collected from around 3,000 sample locations distributed across the UK by around 3,000 skilled volunteers each year.
The sampling locations are largely chosen by the recorder, and so are not evenly distributed across the UK. Sites are recorded repeatedly throughout any given year. Volunteer recorders are well supported and receive training and guidance on collecting and submitting data by Butterfly Conservation.
The primary method for capturing UK Butterfly Monitoring Scheme (UKBMS) data, including the Wider Countryside Butterfly Survey (WCBS), is through the UKBMS online data capture system. Data are processed on an annual basis. The majority of data are from surveys conducted in the previous summer, but data from previous years are also often collated. All data are processed in the same way.
All UKBMS data are collated into a single data set to enable analysis and reporting. As of 2024, the data set comprises about 11 million butterfly counts. Data undergoes a verification process through which automated checks are applied and the data are reviewed by experts. More detail on the data collection, processing and verification process can be found in the published statistical release.
Data analysis
The calculation of species trends from UKBMS data is not a straightforward calculation because not all transect sites in the UKBMS data set have been recorded each year and the number of weeks with transect counts varies markedly between sites and year. The analytical steps taken to produce the estimates of butterfly populations are as follows:
- Calculation of a total abundance estimate for each species, at each site within each year, to account for missing data.
- Combining separate site level abundance into a single time series for each species.
- Calculation of multi-species (composite) indices and trends.
More details for which can be found in the published statistical release.
Not all transect sites in the UKBMS data set have been recorded each year and the number of weeks with transect counts varies markedly between sites and year. A statistical model is therefore needed to produce a regional or national index of how butterfly populations have changed each year. A Generalized Abundance Index (GAI) method is used which is designed for seasonal invertebrates and is applied to the UKBMS data to calculate annual indices of abundance and assess trends.
The next stage of the analysis is then applied to the corrected total annual counts, accounting for where the counts occur within the flight season, to then calculate annual population indices (or time series) for each species using a statistical model to account for sites and years. The national collated index is the mean (on a log scale) of the imputed and recorded site indices for each year. Long-term and decadal trends are calculated for each species at UK level where sufficient data are available. Species trends are estimated by fitting linear models to the collated indices for each species over the entirety of its time series (long-term trend) and for the last ten years (short-term trend). Percentage changes in abundance, over the last ten years and the full time series, are calculated using the change rates obtained from the relevant fitted linear models.
The UK Biodiversity Indicators use multi-species (composite) indices of abundance for butterflies in different habitats, for example, farmland and woodland. Composite indices are derived by calculating the geometric mean index across each species assemblage.
TrendSpotter software (Visser, 2004) is used to identify periods of significant change in butterfly abundance. Periods of significant change are identified by comparing the difference in the index for the first and last year of any given time period. Thresholds for determining change are given in Table 1 (see Soldaat et al., 2007). This classification is not the same as that used for the individual species trends presented in the data set (increased, decreased and no change).
Table 1: Classification of composite trends on the basis of the 95% confidence intervals of the yearly change rates in TrendSpotter smoothed indices (see Soldaat et al., 2007 for explanation).
| Trend class | Criteria | Description |
|---|---|---|
| Improving | Lower confidence limit greater than 1.00 | Increase |
| Little or no change | Confidence interval contains 1.00 AND lower confidence limit greater than or equal to 0.95 AND upper confidence limit less than or equal to 1.05 | Population changes less than 5% per year |
| Declining | Upper confidence limit less than 1.00 | Decrease |
Development plan
Future developments to be implemented over the coming years for the Butterflies in the United Kingdom and in England are:
- Review the species to be included in all measures and incorporate any additional species where data availability allows.
- Review the method for producing the composite indicators alongside recent research developments and consider how to adapt it further if appropriate.
- Consider alternative methods for assessing change in the indices. For instance, consider basing assessments on the annual average rate of change.
- Carry out some targeted user engagement to gauge the impact of our developments on the value of the statistics for their users.
References
- Brakefield, P. M., (1987). Geographical variability in, and temperature effects on, the phenology of Maniola jurtina and Pyronia tithonus (Lepidoptera, Satyrinae) in England and Wales. Ecological entomology, 12(2), pp.139-148.
- Brereton, T. M., Roy D. B., Middlebrook, I., Botham, M. & Warren, M., (2011). The development of butterfly indicators in the United Kingdom and assessments in 2010. Journal of Insect Conservation, 15, 139-151.
- Dennis, E. B., Morgan, B. J., Freeman, S. N., Brereton, T. M. & Roy, D. B., (2016). A generalized abundance index for seasonal invertebrates. Biometrics, 72(4), pp.1305-1314.
- Gregory, R. D., Vorisek, P., van Strien, A. J., Gmelig Meyling, A. W., Jiguet, F., Fornasari, L., Jiri, R., Chylarecki, P. & Burfield, I. J., (2007). Population trends of widespread woodland birds in Europe. Ibis: 149 (Suppl. 2), 78–97.
- Harvey, A. C., (1989). Forecasting structural time series models and the Kalman filter. Cambridge University Press, London.
- Rothery, P. & Roy, D. B., (2001). Application of generalized additive models to butterfly transect count data. Journal of Applied Statistics, 28(7), pp.897-909.
- Soldaat, L. L., Visser, P., van Roomen, M. & van Strien, A. (2007). Smoothing and trend detection in waterbird monitoring data using structural time-series analysis and the Kalman filter. Journal of Ornithology. Vol. 148 suppl. 2. Dec. 2007.
- ter Braak, C. J. F., van Strien, A. J., Meijer, R., & Verstrael, T. J., (1994). Analysis of monitoring data with many missing values: which method? In Bird Numbers 1992: Distribution, monitoring and ecological aspects. (eds W. Hagemeijer & T. Verstrael), pp. 663-673. SOVON, Beek-Ubbergen, Netherlands.
- Visser, H., (2004). Estimation and detection of flexible trends. Atm Environment 38: 4135-4145.
- Visser, H., (2005). The significance of climate change in the Netherlands. An analysis of historical and future trends (1901-2020). MNP report 55000200.
Categories:
Published: