Status of pollinating insects
Last updated: 2025
Latest data available: 2024
Note
As of January 2026, we have corrected the total number of species of pollinators throughout the text.
Due to issues with the statistical modelling, it has not been possible to update the individual measures for wild bees and hoverflies. As a result, the indicator is now labelled as an Official Statistic in Development to allow for further development and consultation with users
Introduction
This indicator reports changes in the distribution of some key pollinator groups (bees and hoverflies) in the UK. The indicator is based on 393 species (158 species of bee and 235 species of hoverfly), and measures change in the number of 1 kilometre grid squares across the UK in which they were recorded in any given year: this is referred to as the ‘occupancy index’. Many insect species are involved in pollination, but bees and hoverflies are known to be important and are presented here as an indicator of overall pollinator trend.
Data for this indicator can be found in the published datafile.
Type of indicator
Benefit indicator
Type of official statistics
Official statistic in development – indicator under development: The biodiversity indicators project team would welcome feedback on the novel methods used in the development of this indicator, please email us. For more information, please visit the UK Statistics Authority’s website on Types of official statistics – UK Statistics Authority.
Contents
- Assessment of change
- Key results
-
Wild bee and hoverfly indicators
- Wild bee index 1980 to 2022 (not updated in 2025)
- Figure 3: Change in the distribution of 158 wild bee species in the UK, 1980 to 2022
- Figure 4: Long-term and short-term changes in individual species trends for 158 wild bees in the UK, 1980 to 2022
- Hoverfly index 1980 to 2022 (not updated in 2025)
- Figure 5: Change in the distribution of 236 hoverfly species in the UK, 1980 to 2022
- Figure 6: Long-term and short-term changes in individual species trends for 236 hoverflies in the UK, 1980 to 2022
- Further detail
- Acknowledgements
- Technical Annex
- References
Assessment of change
This indicator has not been assessed due to challenges with the statistical modelling.
Key results
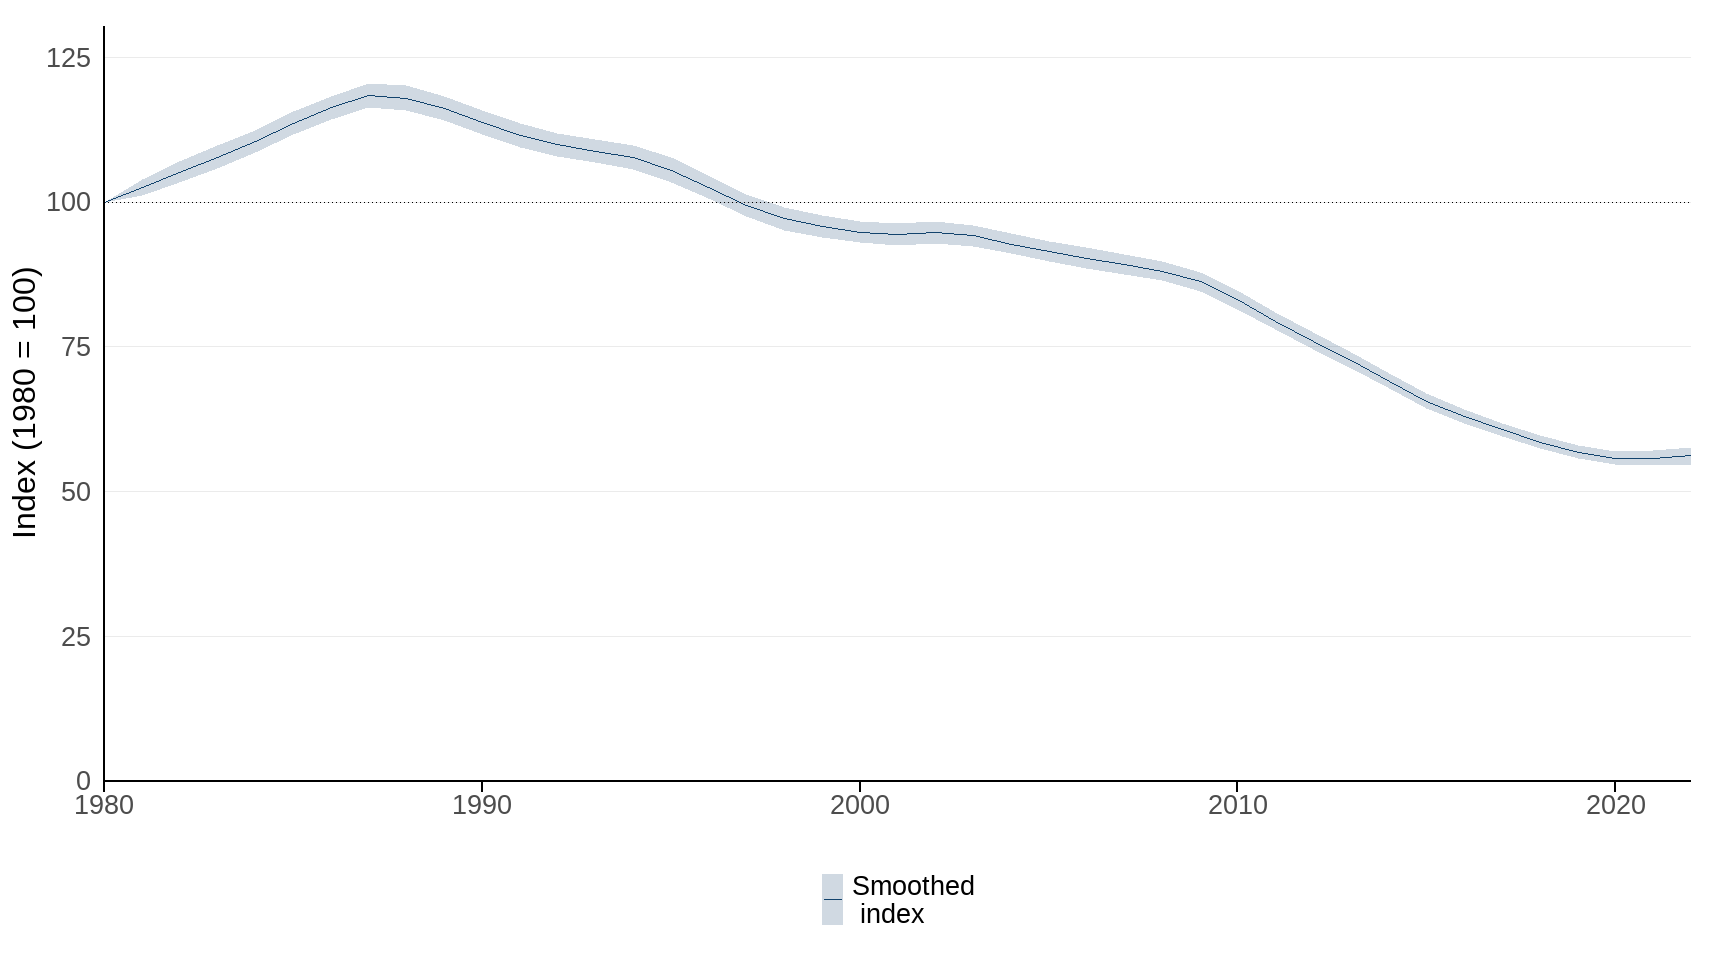
There was an overall decrease in the distribution of pollinators from 1987 onwards. In 2024, the indicator showed a decrease of 23% compared to its value in 1980 (Figure 1).
Between 2019 and 2024, the indicator showed no change.
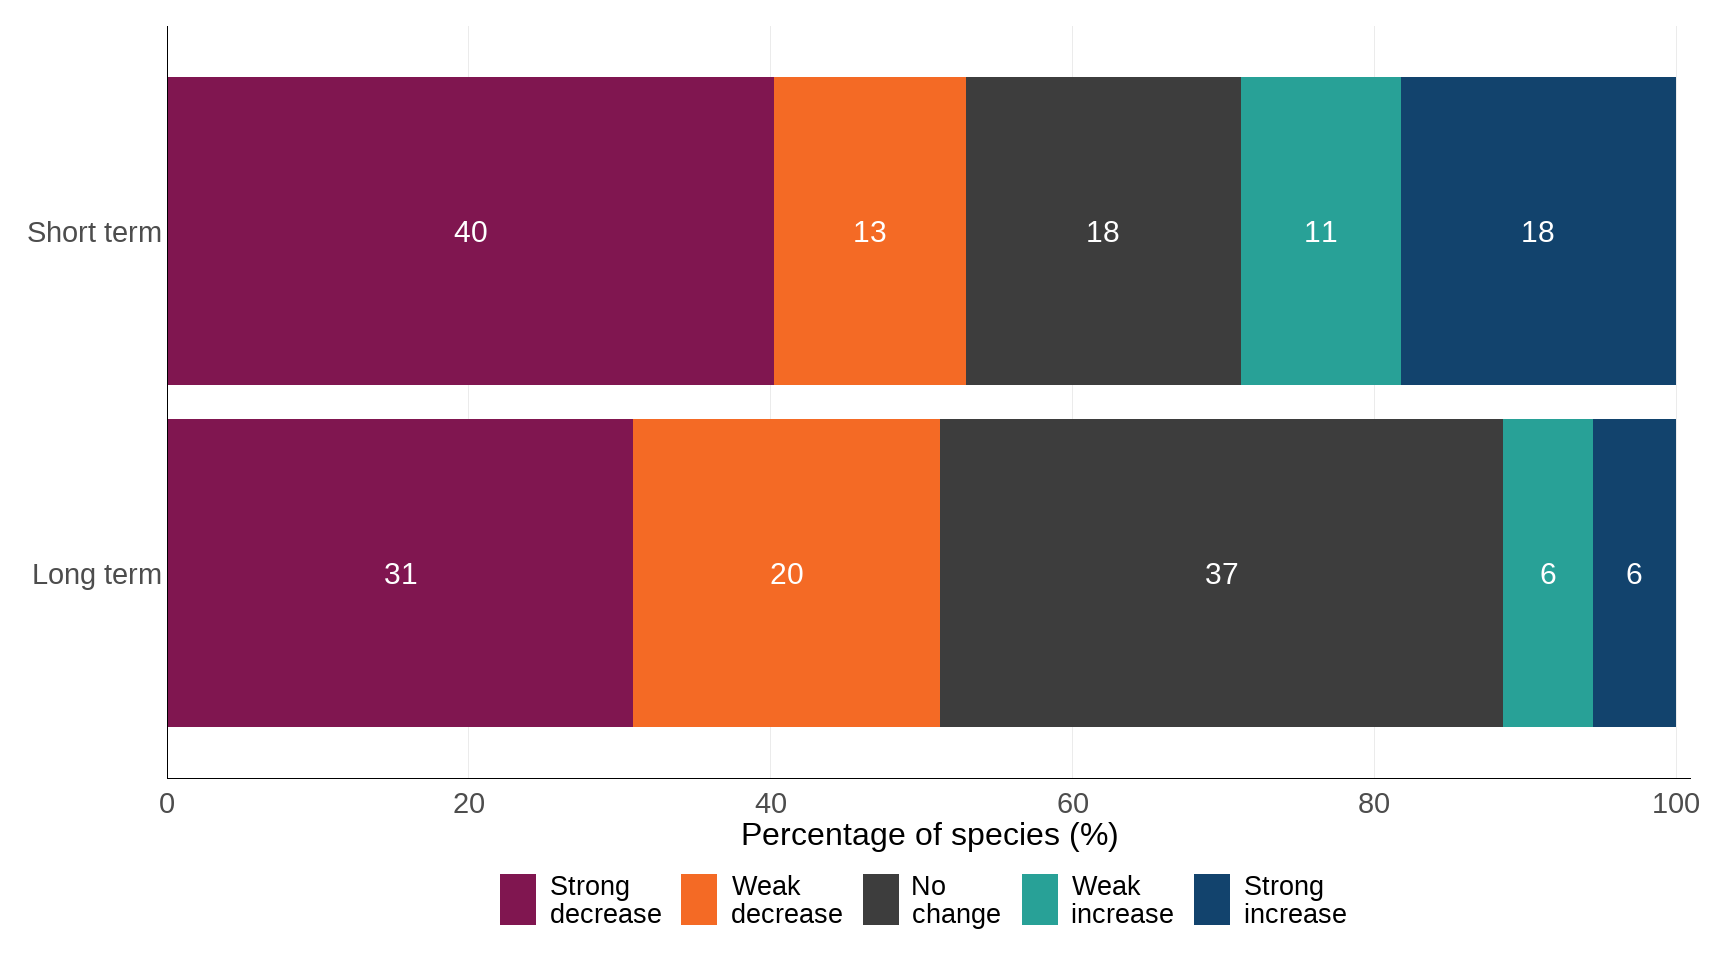
Over the long term, 19% of pollinator species became more widespread (11% exhibiting a strong increase), and 38% pollinator species became less widespread (22% exhibiting a strong decline) (Figure 2).
Over the short term, 37% of pollinator species became more widespread (19% exhibiting a strong increase), and 38% of pollinator species became less widespread (25% exhibiting a strong decline) (Figure 2).
As individual pollinator species become more or less widespread, the communities in any given area become more or less diverse. This may have implications for pollination as more diverse communities are, in broad terms, more effective in pollinating a wider range of crops and wild flowers. Despite the inter-annual variation, the overall trend for pollinators remains downward.
Figure 1: Change in the distribution of 393 UK pollinators, 1980 to 2024
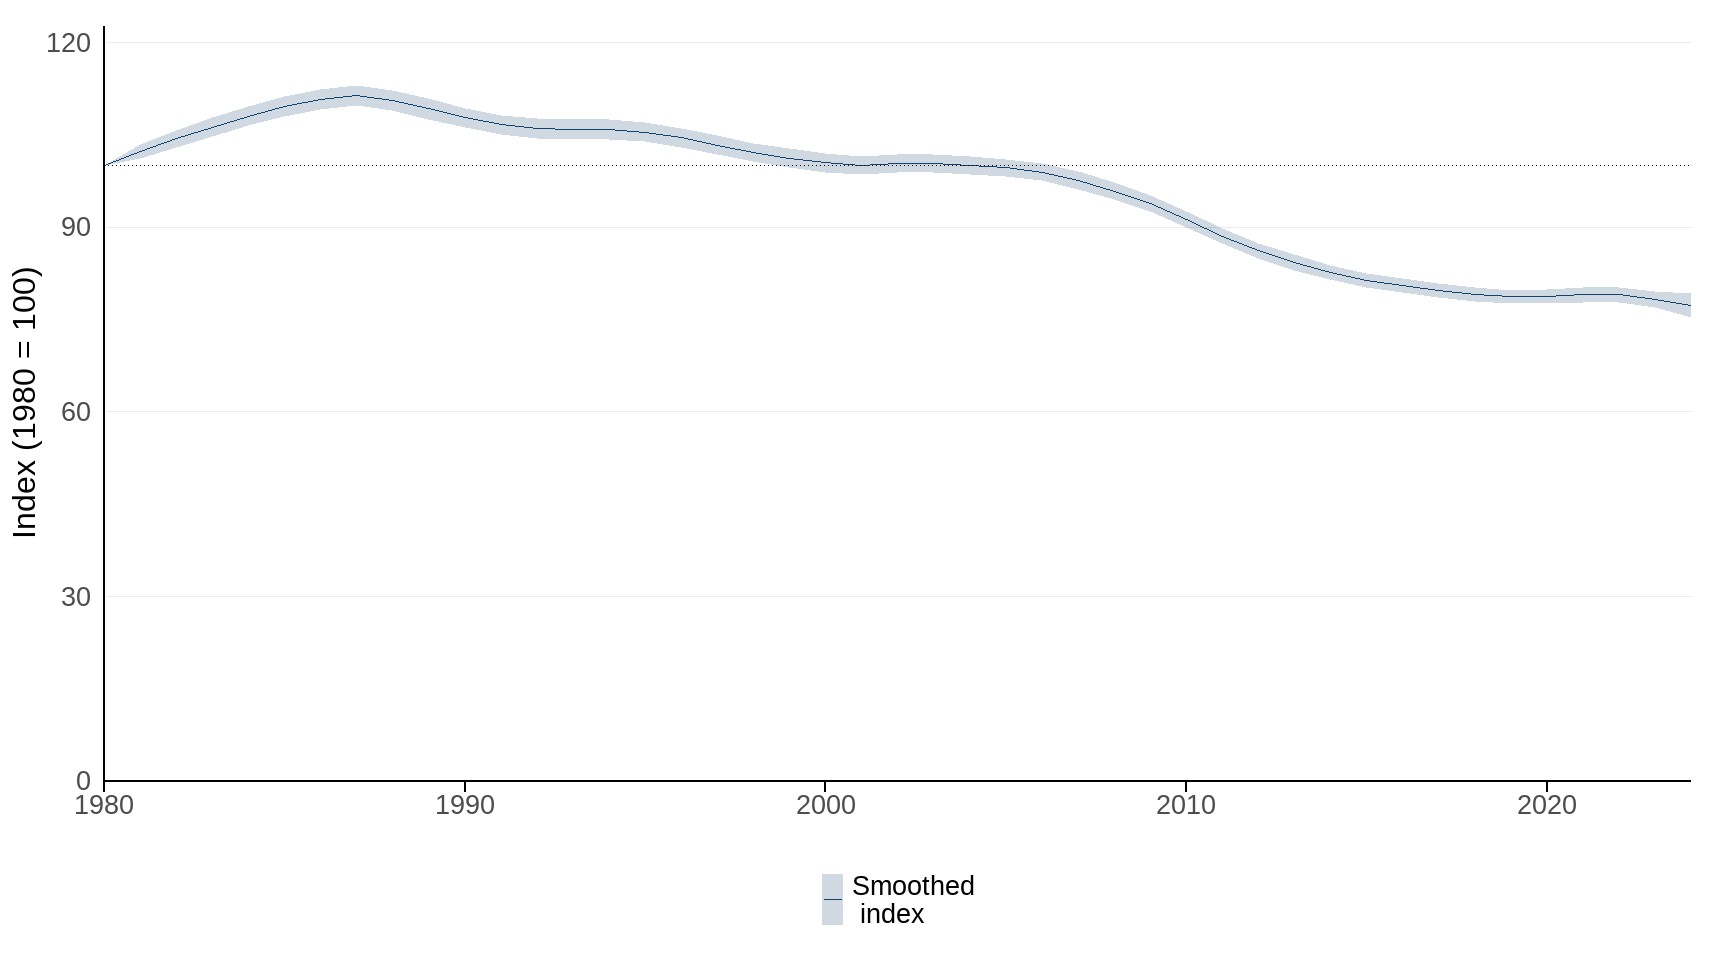
Source: Bees, Wasps & Ants Recording Society; Biological Records Centre (supported by the UK Centre for Ecology & Hydrology and Joint Nature Conservation Committee); Hoverfly Recording Scheme
Notes about Figure 1
- The indicator includes 393 species (158 wild bee and 235 hoverfly species); the number of species can vary between years.
- The line chart shows the smoothed composite indicator trend with variation around the line (shaded area) within which users can be 95% confident that the true value lies (credible interval).
Figure 2: Long-term and short-term changes in individual species trends for 393 pollinators in the UK, 1980 to 2024
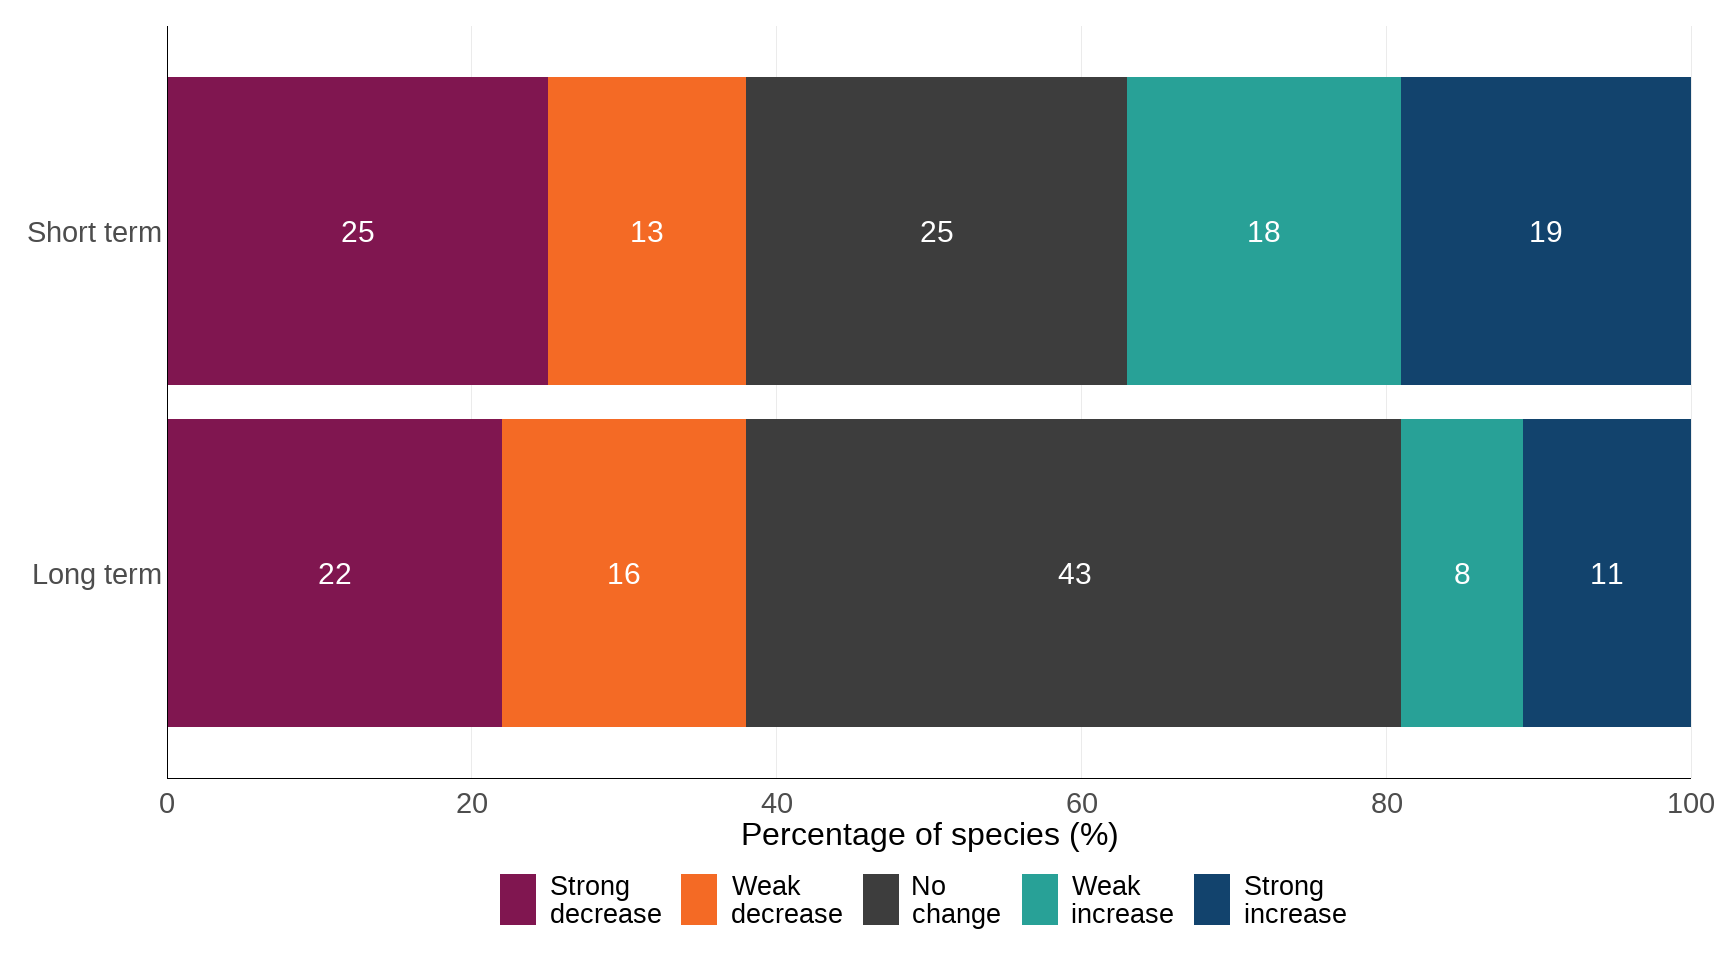
Source: Bees, Wasps & Ants Recording Society; Biological Records Centre (supported by the UK Centre for Ecology & Hydrology and Joint Nature Conservation Committee); Hoverfly Recording Scheme
Note about Figure 2
- The bar chart shows the percentage of species within the indicator that have increased, decreased or shown little change in occupancy, based on thresholds of change (see Table 1 in the Technical Annex).
Wild bee and hoverfly indicators
Wild bee index 1980 to 2022 (not updated in 2025)
Due to issues with the statistical modelling, it has not been possible to update the individual measures for wild bees.
The wild bee index, Figure 3, fluctuates around its initial value over much of the time series, but in 2022 it was estimated to be 19% higher than in 1980.
A greater proportion of bee species have increased than decreased in occupancy over both the long and short term. Over the long term, 31% of bee species became more widespread (13% exhibiting a strong increase), and 26% of bee species became less widespread (7% exhibiting a strong decline) (Figure 4).
Over the short term, 56% of bee species became more widespread (35% exhibiting a strong increase), and 10% of bee species became less widespread (4% exhibiting a strong decline) (Figure 4).
Loss of foraging habitat is understood to be a major driver of change in bee distribution (Vanbergen et al., 2014) and pesticide use has been shown to have an effect on bee behaviour and survival (Stanley et al., 2015). Weather effects, particularly wet periods in the spring and summer, are also likely to have had an impact. Further research would help to better understand the relative importance of these potential drivers of change.
Figure 3: Change in the distribution of 158 wild bee species in the UK, 1980 to 2022
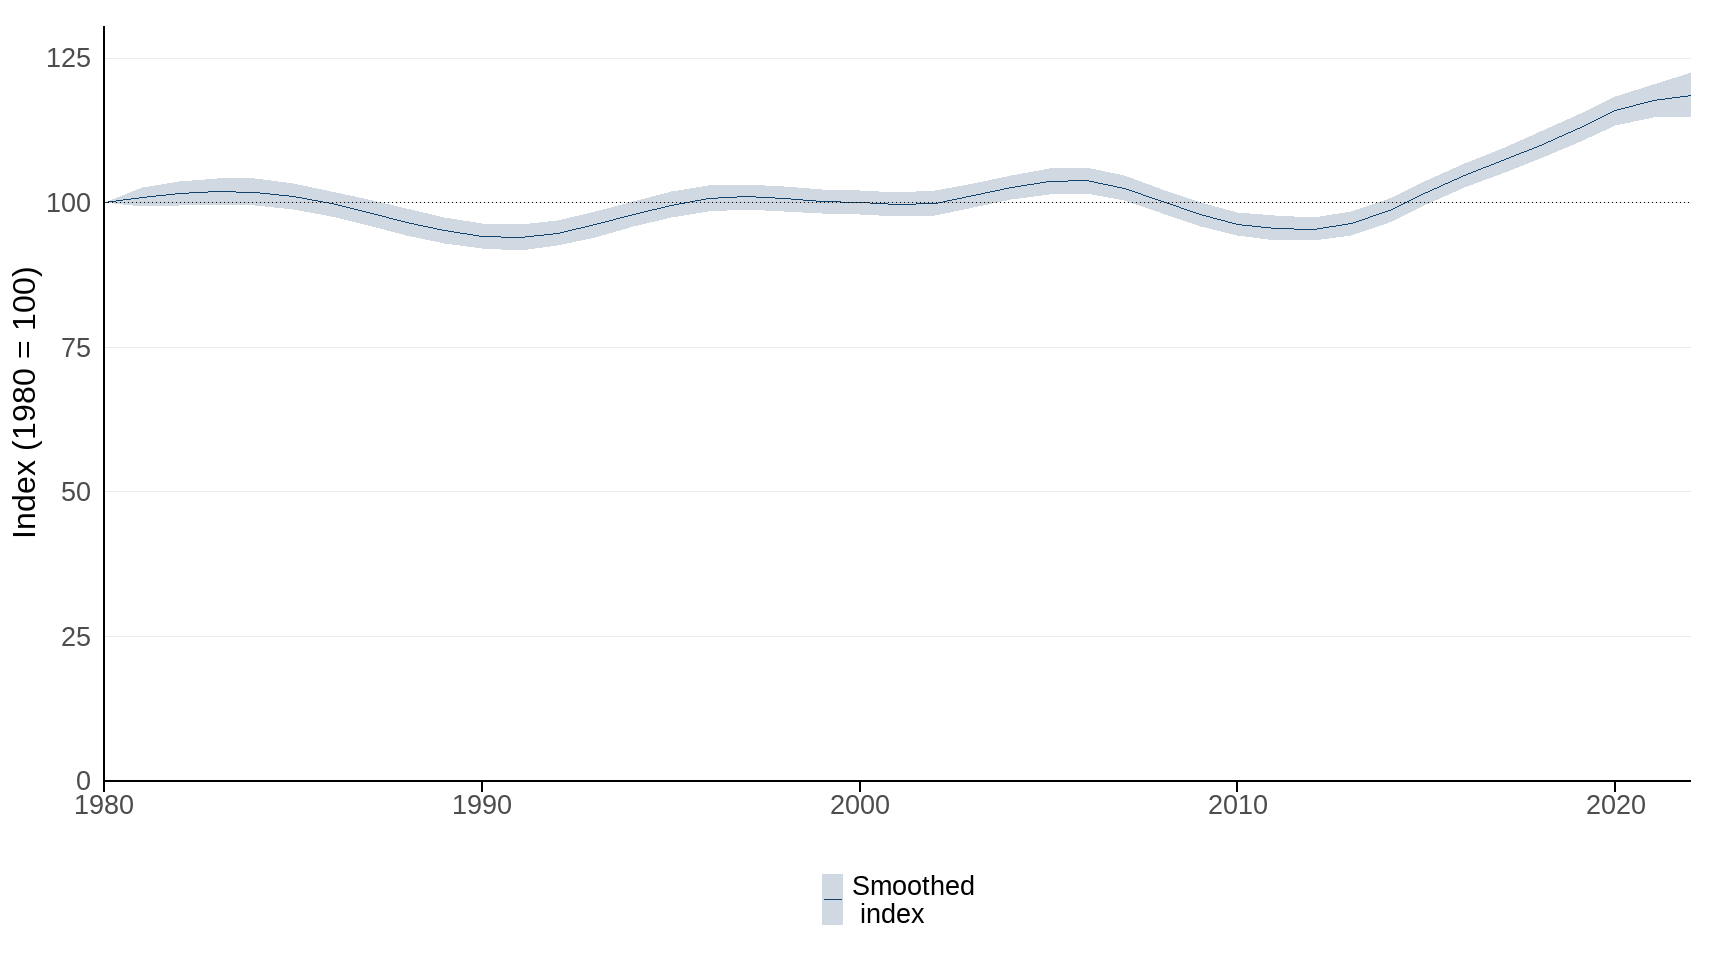
Source: Bees, Wasps & Ants Recording Society; Biological Records Centre (supported by the UK Centre for Ecology & Hydrology and Joint Nature Conservation Committee)
Notes about Figure 3
- The index includes 158 wild bee species; the number of species can vary between years.
- The line chart shows the smoothed composite indicator trend with variation around the line (shaded area) within which users can be 95% confident that the true value lies (credible interval).
Figure 4: Long-term and short-term changes in individual species trends for 158 wild bees in the UK, 1980 to 2022
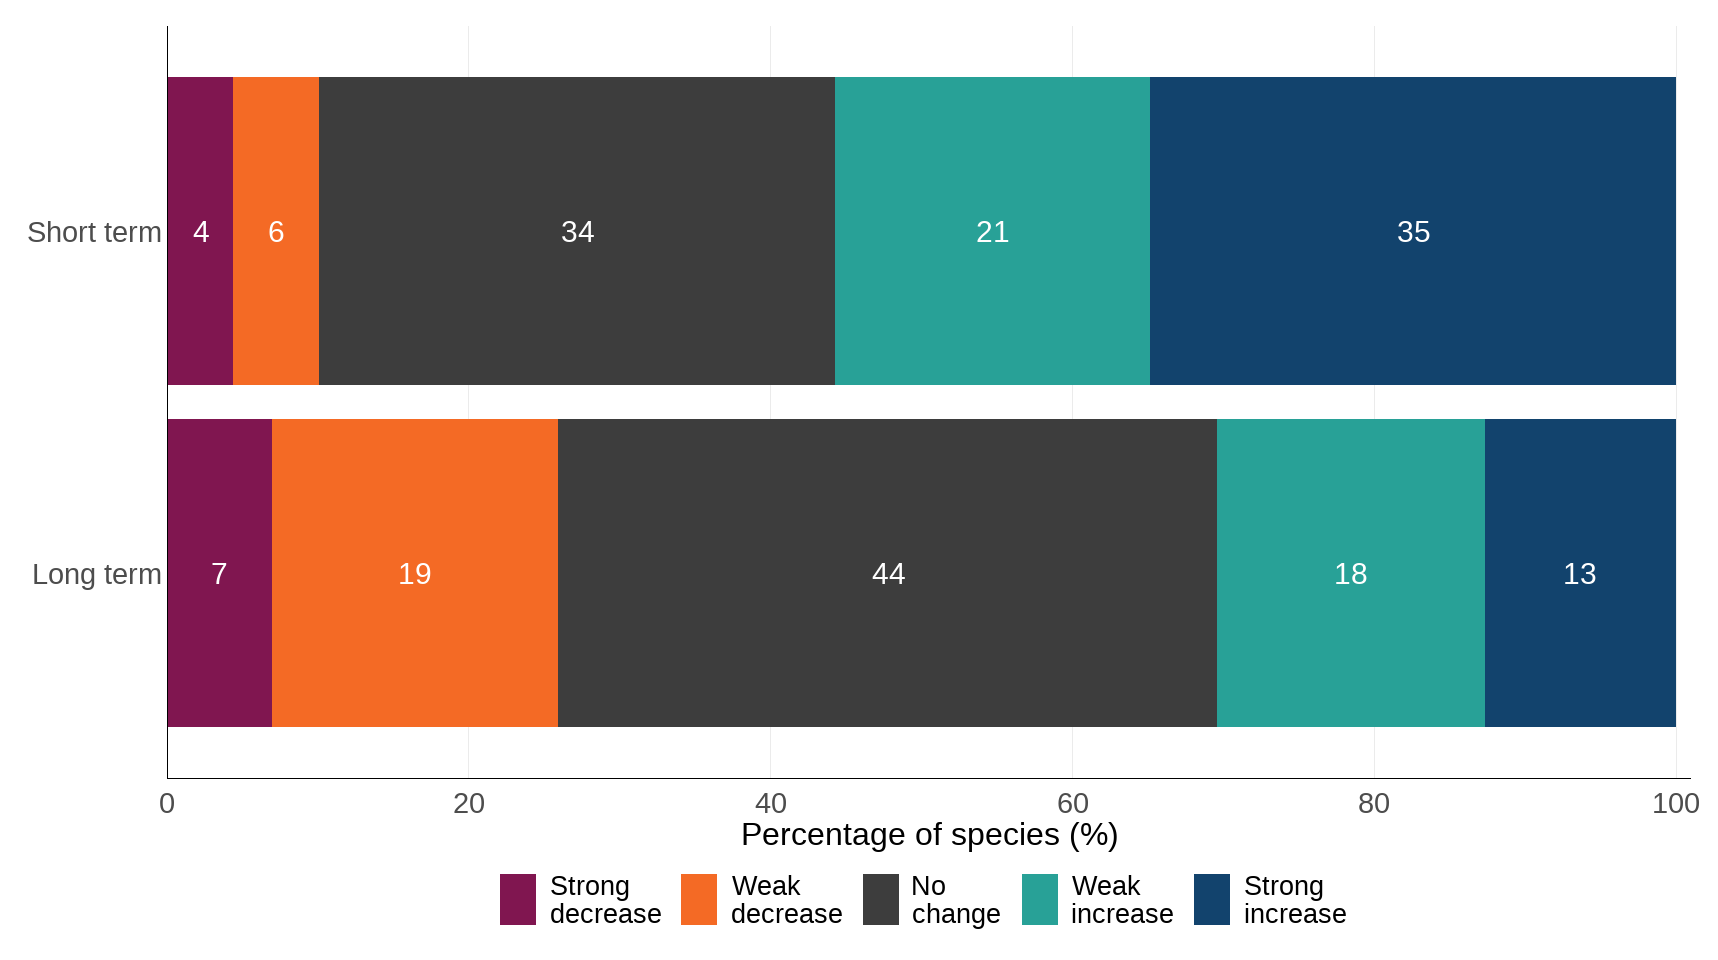
Source: Bees, Wasps & Ants Recording Society; Biological Records Centre (supported by the UK Centre for Ecology & Hydrology and Joint Nature Conservation Committee)
Note about Figure 4
- The bar chart shows the percentage of species within the indicator that have increased, decreased or shown little change in occupancy, based on set thresholds of change (see Table 1 in the Technical Annex).
Hoverfly index 1980 to 2022 (not updated in 2025)
Due to issues with the statistical modelling, it has not been possible to update the individual measures for hoverflies.
The hoverflies index, Figure 5, peaked in 1987 (18% higher than the baseline of 100 in 1980), and then underwent a progressive decline. In 2022 it was estimated to be 44% lower than in 1980.
A greater proportion of hoverflies have declined than increased in occupancy over both the long and short term. Over the long term, 12% of hoverfly species became more widespread (6% exhibiting a strong increase), and 51% of hoverfly species became less widespread (31% exhibiting a strong decline) (Figure 6).
Over the short term, 29% of hoverfly species became more widespread (18% exhibiting a strong increase), and 53% of hoverfly species became less widespread (40% exhibiting a strong decline) (Figure 6).
It is not clear why hoverflies show a different trend to bees, although differences in the life cycle will mean they respond differently to weather events and habitat change.
Figure 5: Change in the distribution of 236 hoverfly species in the UK, 1980 to 2022
Source: Hoverfly Recording Scheme; Biological Records Centre (supported by the UK Centre for Ecology & Hydrology and Joint Nature Conservation Committee)
Notes about Figure 5
- The index includes 236 hoverfly species; the number of species can vary between years.
- The line chart shows the smoothed composite indicator trend with variation around the line (shaded area) within which users can be 95% confident that the true value lies (credible interval).
Figure 6: Long-term and short-term changes in individual species trends for 236 hoverflies in the UK, 1980 to 2022
Source: Hoverfly Recording Scheme; Biological Records Centre (supported by the UK Centre for Ecology & Hydrology and Joint Nature Conservation Committee)
Note about Figure 6
- The bar chart shows the percentage of species within the indicator that have increased, decreased or shown little change in occupancy, based on set thresholds of change (see Table 1 in the Technical Annex).
Further detail
For information on the methods used in this indicator, please see the Technical Annex below.
Relevance
Pollination is a vital ecosystem service that benefits agricultural and horticultural production and is essential for maintaining wild flower biodiversity. By improving the yield, quality and resilience of crops, insect pollination has been valued at £400 million per year to the UK economy (POST, 2010). 35% of the world’s agricultural output, by volume, consists of 87 crop types that benefit from pollination by animals (insects, birds, and mammals), but because most of these crops are not entirely dependent on animal pollination, the amount of production directly attributable to animals is lower than this value (Klein et al., 2007). There is growing concern regarding the population status of insect pollinators, and in turn the pollination service they provide (Potts et al., 2010 and Garratt et al., 2014). Knowledge of the population dynamics and distribution of pollinators, helps us assess the risk to the services they provide.
As with most other areas of biodiversity, the main threats to pollinators include habitat loss, environmental pollution, climate change and the spread of alien species (Klein et al., 2007, Potts et al., 2010, Vanbergen and the Insect Pollinators Initiative 2013). The widespread application of pesticides is also perceived as a major threat to pollinator diversity (Brittain et al., 2010).
Many wild bees and other insect pollinators have become less widespread, particularly those species associated with semi-natural habitats. At the same time, a smaller number of pollinating insects have become more widespread. This may have implications for the pollination service they provide to crops and wild flowers and is an area of active research (Potts et al., 2010 and Garratt et al., 2014).
In order for governments to act upon these threats they need robust metrics on the national-scale status of pollinators and pollination, though deriving such a metric has previously been limited by the availability of suitable data and analytical techniques, and the species considered to be wild pollinators are subject to debate (Hutchinson et al., 2021).
With the increase in citizen science, the availability of large-scale biological record data has increased (Silvertown, 2009). Such data are collected without a standardised survey protocol and therefore extracting reliable trends from them can be difficult. However, with recent analytical advances it is now possible to estimate reliable trends from such data (van Strien et al., 2013, Isaac et al., 2014).
International/domestic reporting
The suite of UK Biodiversity Indicators has been revised and updated to bring it in line with the Kunming-Montreal Global Biodiversity Framework (GBF) of the Convention on Biological Diversity (CBD). Some UKBIs will be used for the forthcoming UK national reports to CBD.
This indicator also feeds into the Environmental Indicator Framework (previously known as the Outcome Indicator Framework), a set of indicators describing environmental change related to the ten goals within the Environmental Improvement Plan. As part of the Environmental Indicator Framework, this data contributes towards the evidence base used to prepare the annual progress report for the Environmental Improvement Plan. This indicator contributes to indicator D7: Species supporting ecosystem functions.
Web links for further information
- CBD’s website on the Kunming-Montreal Global Biodiversity Framework 2030 targets
- Environmental Improvement Plan on the.gov.uk website
Acknowledgements
Thank you to the many people who have contributed by providing data and to the many colleagues who have helped produce this indicator. In particular, thanks go to the Bees, Wasps & Ants Recording Society, the Hoverfly Recording Scheme, the Biological Records Centre, and UK Centre for Ecology & Hydrology.
Technical Annex
Data sources
Distribution records of bee and hoverfly species within 1 kilometre grid cells in the UK originate from the Bees, Wasps and Ants Recording Society (BWARS) and the Hoverfly Recording Scheme biological records databases. The time-period used for the indicator was 1980 to 2024, as this represents a core period of recording for these taxa in the UK. Bee species were filtered (following expert guidance from BWARS) so that only species considered to be wild pollinators were included. Species that had undergone taxonomic changes or had taxonomic issues during the time frame of the indicator were excluded from the analysis.
The final composite indicator is based on 393 species of wild pollinator, see the published datafile which accompanies this indicator for a list of species covered. Note that the species considered to be wild pollinators are subject to review, following feedback from the scientific community and the publication of a literature review of field survey data recording wild bee visits to crops in Great Britain and Europe (Hutchinson et al., 2021).
Generating species’ trends in occupancy
The data used to produce the indicator were not collected using a standardised protocol, but instead are a collation of unstructured biological observations collected by a large network of volunteer recorders.
Such data tend to contain many forms of sampling bias and noise, making it hard to detect genuine signals of change (Tingley and Beissinger, 2009, Hassall and Thompson, 2010; Isaac et al., 2014). Recent studies have highlighted the value of Bayesian occupancy models for estimating species occurrence in the presence of imperfect detection (van Strien et al., 2013, Isaac et al., 2014). This approach uses two hierarchically coupled sub models:
- An occupancy sub-model (that is, presence verses absence) which quantifies the probability that a species is present in a particular place.
- A detection sub model (that is, detection verses non-detection) which quantifies the likelihood that a species is detected.
Together these sub-models estimate the conditional probability that a species is detected when present. Species-specific time series estimates are derived from a Bayesian occupancy model, described in Outhwaite et al., (2019) and following van Strien et al., (2013) and Isaac et al., (2014), with improvements based on Outhwaite et al., (2018). These models are updated as and when new data become available from recording schemes.
For each site-year combination the model estimates presence or absence for the species in question given variation in detection probability: from this the proportion of occupied sites (‘occupancy’) was estimated for each year. To estimate the composite indicator trend with uncertainty, the posterior distribution of the annual occupancy estimates for each species was utilised.
Generating the composite indicator
A change from the approach used to select species-specific trends for the 2021 indicator is the adoption of new criteria (rules-of-thumb), based on the suitability of the underlying data for producing occupancy trends with acceptable precision. This data-driven approach is considered to be more objective than the previous threshold of 50 records (Pocock et al., 2019). Rarely recorded species (less than 1 record in every 100 visits) were excluded if there were fewer than 3.1 records across the 10% of the best recorded years. More frequently recorded species were excluded if there were fewer than 6.7 records across the 10% of the best recorded years (Pocock et al., 2019).
Exclusion criteria are based on classification trees, selected to balance the rates at which species are excluded when not meeting precision thresholds and included when meeting the precision thresholds. In total, the 2022 indicator comprises 393 species that met these criteria for inclusion. This represents a net increase of 12 species compared with the 2021 indicator.
The composite indicator was produced using a novel hierarchical modelling method for calculating multi-species indicators developed by the UK Centre for Ecology & Hydrology (UKCEH) (Freeman et al., 2020), which offers some advantages over the geometric mean method used to produce the 2020 indicator. It can be applied to multiple data types, improving the comparability between metrics derived from occupancy and abundance data and can account for the uncertainty associated with the underlying species-specific time series as well as uncertainty in the indicator arising from the subset of species that are included. Case studies with four taxonomic groups show it to be robust to missing values, especially when these are non-random, for example when declining species are more likely to be missing observations in recent years or if recent colonists are absent earlier in the time series. Imputing missing values is informed by between-year changes in species for which data is available, assuming shared environmental responses. Additionally, a smoothing process is used to reduce the impact of between-year fluctuations - such as those caused by variation in weather - making underlying trends easier to detect. The smoothing parameter (number of knots) was set to the number of years divided by three following Fewster et al., (2000).
The indicator represents annual change in the geometric mean estimated occupancy across the constituent species. The index is set to a value of 100 in the start year (the baseline), so that changes subsequent to this represent proportional change in occupancy; if on average species’ trends doubled, the indicator would rise to 200, if they halved it would fall to a value of 50.
Species-specific trends
For each species, the long- and short-term trend in occupancy was estimated as the mean annual percent change (over the time-period in question) across 1,000 estimates from the posterior distribution. Species were grouped into one of five categories based on both their short-term and long-term occupancy trend (Table 1). The threshold values for each category were based on those of the wild bird indicator; whether an individual species is increasing or decreasing has been decided by its rate of annual change over the time period (long or short) of interest. If the rate of annual change would lead to an occupancy increase or decrease of between 25% and 49% over 25 years, the species is said to have shown a ‘weak increase’ or a ‘weak decrease’ respectively. If the rate of annual change would lead to a population increase or decrease of 50% or more over 25 years, the species is said to have shown a ‘strong increase’ or a ‘strong decline’ respectively. These thresholds are used in the Birds of Conservation Concern status assessment for birds in the UK.
Table 1: Thresholds used to define individual species trends
| Category | Thresholds | Threshold equivalent |
|---|---|---|
| Strong increase | Above +2.81% per annum (pa) | +100% over 25 years |
| Weak increase | Between +1.16% and +2.81% pa | +33% to +100% over 25 years |
| No change | Between -1.14% and +1.16% pa | -25% to +33% over 25 years |
| Weak decrease | Between -2.73% and -1.14% pa | -50% to -25% over 25 years |
| Strong decrease | Below -2.73% pa | -50% over 25 years |
Recent developments
The pollinators measure has been updated this year with data up to and including 2024. However, due to issues with the statistical modelling, the measures for both wild bees and hoverflies have not been updated.
Development plan
We are keen to hear feedback from users of these statistics, please send your feedback to: biodiversity@defra.gov.uk.
Development plans over the next few years:
- We will update the data for both wild bees and hoverflies that could not be updated in this publication.
- We will incorporate any developments that arise from the development plan of the species abundance indicators.
- We will further explore differences between the outputs of the occti and sparta models to decide on an approach that suits all taxonomic groups and has a viable computation time.
References
- Boyd, R. J., Powney, G. D., Burns, F., Danet, A., Duchenne, F., Grainger, M. J., Jarvis, S. G., Martin, G., Nilsen, E. B., Porcher, E., Stewart, G. B., Wilson, O. J. and Pescott, O. L. 2022. ROBITT: A tool for assessing the risk-of-bias in studies of temporal trends in ecology. - Methods Ecol Evol 13: 1497–1507.
- Breeze, T.D., Bailey, A.P., Balcombe, K.G. and Potts, S.G. (2011) Pollination services in the UK: How important are honeybees? Agriculture, Ecosystems & Environment, 142, pp. 137 to 143
- Brittain, C. A., Vighi, M., Bommarco, R., Settele, J. and Potts, S.G. (2010) Impacts of a pesticide on pollinator species richness at different spatial scales. Basic and Applied Ecology, 11, pp.106 to 115
- Fewster, R. M., Buckland, S. T., Siriwardena, G. M., Baillie, S. R., and Wilson, J. D. (2000). Analysis of population trends for farmland birds using generalized additive models. Ecology, 81(7), 1970 to 1984.
- Freeman, S.N., Isaac, N.J.B., Besbeas, P. et al., A Generic Method for Estimating and Smoothing Multi-species Biodiversity Indicators Using Intermittent Data. JABES 26, 71–89 (2021). https://doi.org/10.1007/s13253-020-00410-6
- Garratt, M.P.D., Truslove, C.L., Coston, D.J., Evans, R.L., Moss, E.D., Dodson, C., Jenner, N., Biesmeijer, J.C. and Potts, S.G. (2014) Pollination deficits in UK apple orchards. Journal of Pollination Ecology, 12, pp. 9 to 14
- Hassall, C. and Thompson, D.J. (2010) Accounting for recorder effort in the detection of range shifts from historical data. Methods in Ecology and Evolution, 1, pp.343 to 350
- Hutchinson, L.A., Oliver, T.H., Breeze, T.D., Bailes, E.J., Brünjes, L., Campbell, A.J., … Garratt, M.P.D. (2021). Using ecological and field survey data to establish a national list of the wild bee pollinators of crops. Agriculture, Ecosystems & Environment, 315, 107447
- Isaac, N.J.B., van Strien, A.J., August, T.A., de Zeeuw, M.P. and Roy, D.B. (2014) Statistics for citizen science: extracting signals of change from noisy ecological data. Methods in Ecology and Evolution, 5, pp.1052 to 1060
- Klein, A.-M., Vaissière, B.E., Cane, J.H., Steffan-Dewenter, I., Cunningham, S.A, Kremen, C. and Tscharntke, T. (2007) Importance of pollinators in changing landscapes for world crops. Proceedings. Biological sciences / The Royal Society, 274, pp.303 to 313
- Outhwaite, C.L., Chandler, R.E., Powney, G.D., Collen, B., Gregory, R.D. and Isaac N. J. B. (2018) Prior specification in Bayesian occupancy modelling improves analysis of species occurrence data. Ecological Indicators, 93, pp.333 to 343
- Outhwaite, C.L., Powney, G.D., August, T.A., Chandler, R.E., Rorke, S., Pescott, O.L., … Isaac, N.J.B. (2019) Annual estimates of occupancy for bryophytes, lichens and invertebrates in the UK, 1970 to 2015. Scientific Data 6, p.259.
- Pocock, M. J. O., Logie, M. W., Isaac, N. J. B., Outhwaite, C. L., and August, T. (2019). Rapid assessment of the suitability of multi-species citizen science datasets for occupancy trend analysis. BioRxiv. doi: 10.1101/813626 POST (2010) Insect Pollination, London
- Potts, S.G., Biesmeijer, J.C., Kremen, C., Neumann, P., Schweiger, O. and Kunin, W.E. (2010) Global pollinator declines: trends, impacts and drivers. Trends in ecology & evolution, 25, pp.345 to 353
- Powney, G.D., Carvell, C., Edwards, M., Morris, R.K.A., Roy, H.E., Woodcock, B.A. and Isaac, N.J.B. (2019) Widespread losses of pollinating insects in Britain. Nature Communications, 10, 1018
- Silvertown, J. (2009) A new dawn for citizen science. Trends in ecology & evolution, 24, pp.467 to 471
- Stanley, D.A. Garratt, M.P.D., Wickens, J.B., Wickens, V.J., Potts, S.G. & Raine, N.E. (2015) Neonicotinoid pesticide exposure impairs crop pollination services provided by bumblebees. Nature, online early
- UK Pollinator Monitoring Scheme (2025). The UK PoMS Annual report 2024. UK Centre for Ecology & Hydrology and Joint Nature Conservation Committee.
- Van Strien, A.J., van Swaay, C. A. M. and Termaat, T. (2013) Opportunistic citizen science data of animal species produce reliable estimates of distribution trends if analysed with occupancy models. Journal of Applied Ecology, 50, pp.1450 to 1458
- Tingley, M.W. and Beissinger, S.R. (2009) Detecting range shifts from historical species occurrences: new perspectives on old data. Trends in Ecology & Evolution, 24, pp.625 to 633
- Vanbergen, A.J. and The Insect Pollinators Initiative. (2013) Threats to an ecosystem service: pressures on pollinators. Frontiers in Ecology and the Environment, 11, pp.251 to 259
- Woodcock, B.A., Edwards, M., Redhead, J., Meek, W.R., Nuttall, P., Falk, S., Nowakowski, M. and Pywell, R.F. (2013) Crop flower visitation by honeybees, bumblebees and solitary bees: Behavioural differences and diversity responses to landscape. Agriculture, Ecosystems & Environment, 171, pp.1 to 8
Categories:
Published: