Animal genetic resources – effective population size of Native Breeds at Risk
Last updated: 2025
Latest data available: 2024
Introduction
This indicator shows the change in the average effective population sizes for breeds of goats, pigs, horses, sheep and cattle classified by the UK Farm Animal Genetic Resources Committee as Native Breeds at Risk (NBAR).
Data for this indicator can be found in the published datafile.
Type of indicator
State / Benefit Indicator
Type of official statistics
Official statistic
Assessment of change
Effective population size of Native Breeds at Risk.
| Measure | Assessment | Time period | Result |
|---|---|---|---|
| Goat breeds | Long term | 2004 to 2024 | Little or no overall change |
| Goat breeds | Short term | 2019 to 2024 | Deteriorating |
| Pig breeds | Long term | 2000 to 2024 | Deteriorating |
| Pig breeds | Short term | 2019 to 2024 | Deteriorating |
| Horse breeds | Long term | 2000 to 2024 | Deteriorating |
| Horse breeds | Short term | 2019 to 2024 | Little or no overall change |
| Sheep breeds | Long term | 2000 to 2024 | Improving |
| Sheep breeds | Short term | 2019 to 2024 | Deteriorating |
| Cattle breeds | Long term | 2000 to 2024 | Improving |
| Cattle breeds | Short term | 2019 to 2024 | Little or no overall change |
Notes on the indicator assessment
Long- and short-term assessments are based on a 5% rule of thumb. Where possible, the base years for these assessments use a three-year average. See Assessing Indicators.
Key results
Genetic diversity is an important component of biological diversity. Rare and native breeds of farm animals are part of our cultural heritage, are often associated with traditional land management required to conserve important habitats, and may have genetic traits of value to future agriculture.
The genetic diversity in UK breeds can be assessed by the effective population size (Ne), which accounts for the total number of animals in a population and the relative numbers of sires and dams (male and female parents). A low effective population size signifies a greater likelihood of inbreeding and risk of loss of genetic diversity.
Of the Native Breeds at Risk included in this indicator:
-
For pigs, the average effective population size changed from 177 in 2000 to 136 in 2019 and then to 96 in 2024;
-
For horses, the average effective population size changed from 224 in 2000 to 98 in 2019 and then to 102 in 2024;
-
For sheep, the average effective population size changed from 245 in 2000 to 418 in 2019 and then to 372 in 2024;
-
For cattle, the average effective population size changed from 121 in 2000 to 258 in 2019 and then to 248 in 2024;
-
For goats, the dataset starts in 2004 when the average effective population size was 63, changing to 100 in 2019 and then to 58 in 2024; prior to 2004, effective population size could only be calculated for one breed.
For the native breeds of goats, pigs, horses, sheep and cattle that are considered to be at risk, their average effective population sizes (calculated between 2000 and 2024) were each above 50, the figure set by the United Nations Food and Agriculture Organisation as a threshold for concern.
However, in 2024, among the Native Breeds at Risk, two goat breeds, four horse breeds, and two cattle breeds had an effective population size (Ne) of 50 or less; no sheep or pig breeds fell into this category.
There has been no reported UK extinction of any breeds of goats, pigs, horses, sheep or cattle since 1973.
The United Nations Food and Agriculture Organisation (FAO) recommends a minimum effective population size (Ne) of at least 50 individuals to reduce the rate of inbreeding to less than 1% and ensure the long-term survival of a breed. Figure 1 shows that, on average, all five species have Ne greater than 50. However, examination of the data for the individual breeds (Figure 2) reveals that there are a small number of breeds with Ne less than or equal to 50 in many years. The breeds which are represented in Figure 2 may change from year to year.
Figure 1: Average effective population size (Ne) of All Native Breeds at Risk, 2000 to 2024
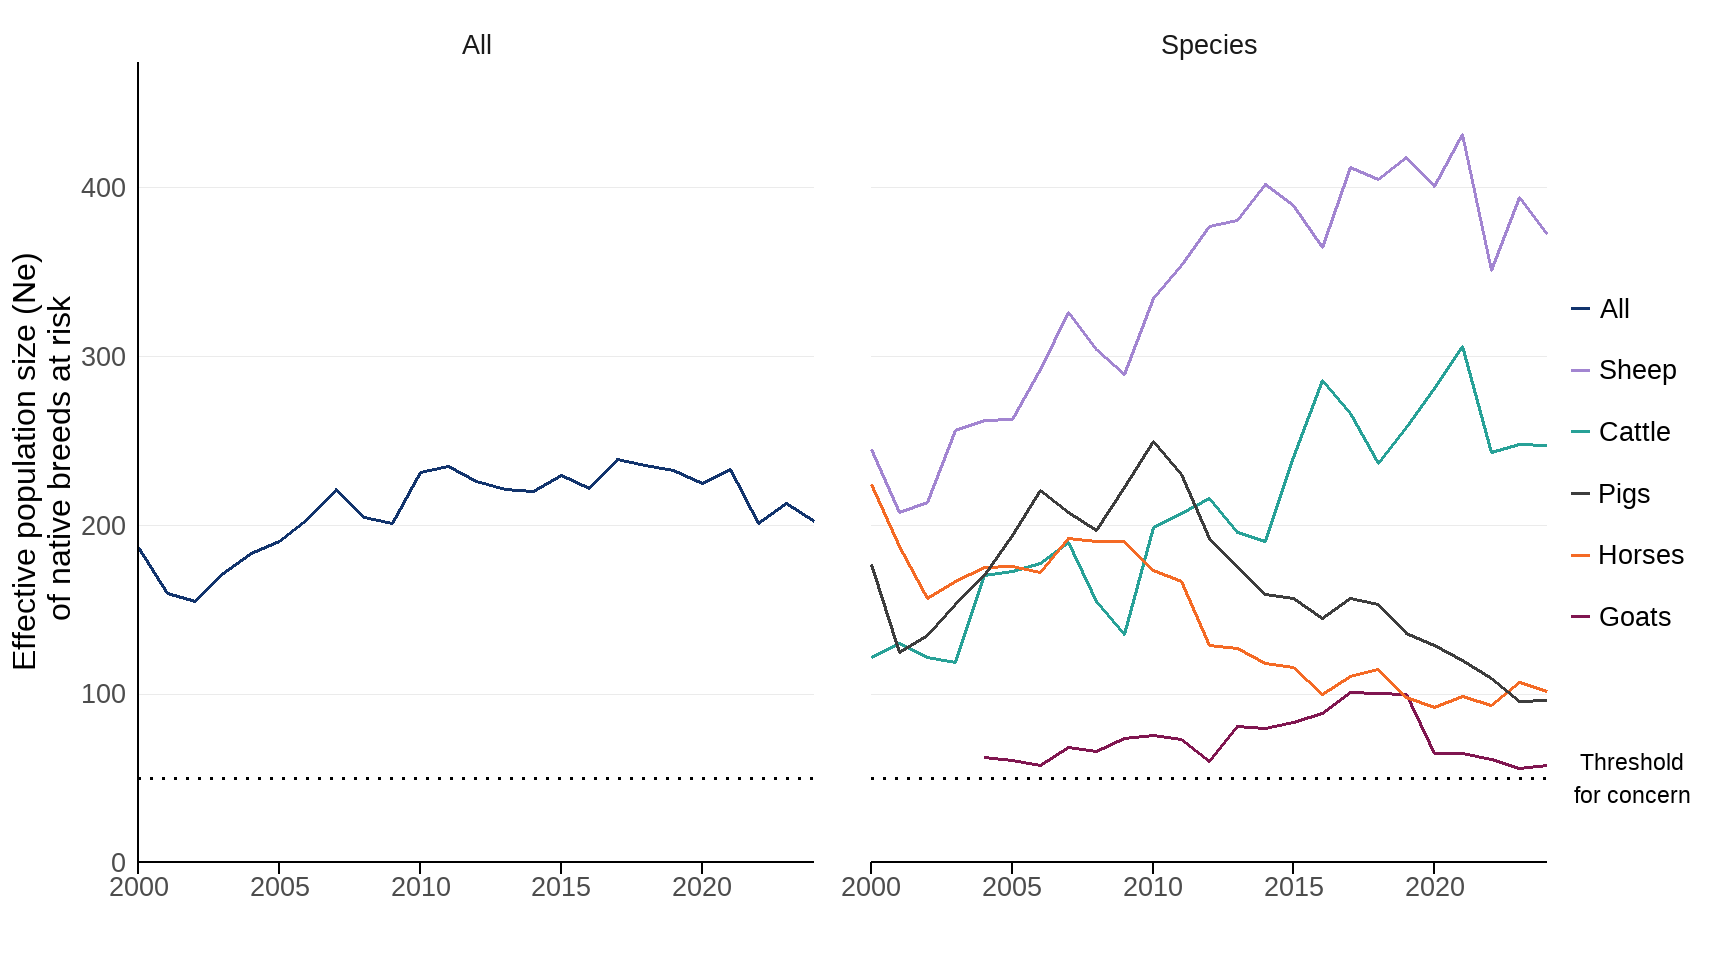
Source: British Pig Association; Defra; Grassroots Systems Ltd; Rare Breeds Survival Trust; and participating breed societies; as published on 15 May 2025 in the UK Farm Animal Genetic Resources Breed Inventory
Notes about Figure 1
- The indicator includes breeds that are classed as NBAR in the breed inventory published in 2025. Changes in NBAR status during the time series have not been factored into the selection of breeds that are included in each year.
- This year’s indicator differs from previous publications due to updates to the Farm Animal Genetic Resources inventory. These include 2024 inventory data, estimated breeding female populations for 2025, and some revisions to earlier years, based on data from breed societies.
- The dotted black line shows effective population size (Ne) equal to 50; the level set by the United Nations Food and Agriculture Organisation as a threshold for concern.
Figure 2: Number of NBAR breeds with Ne less than or equal to 50 within the overall trends, 2000 to 2024
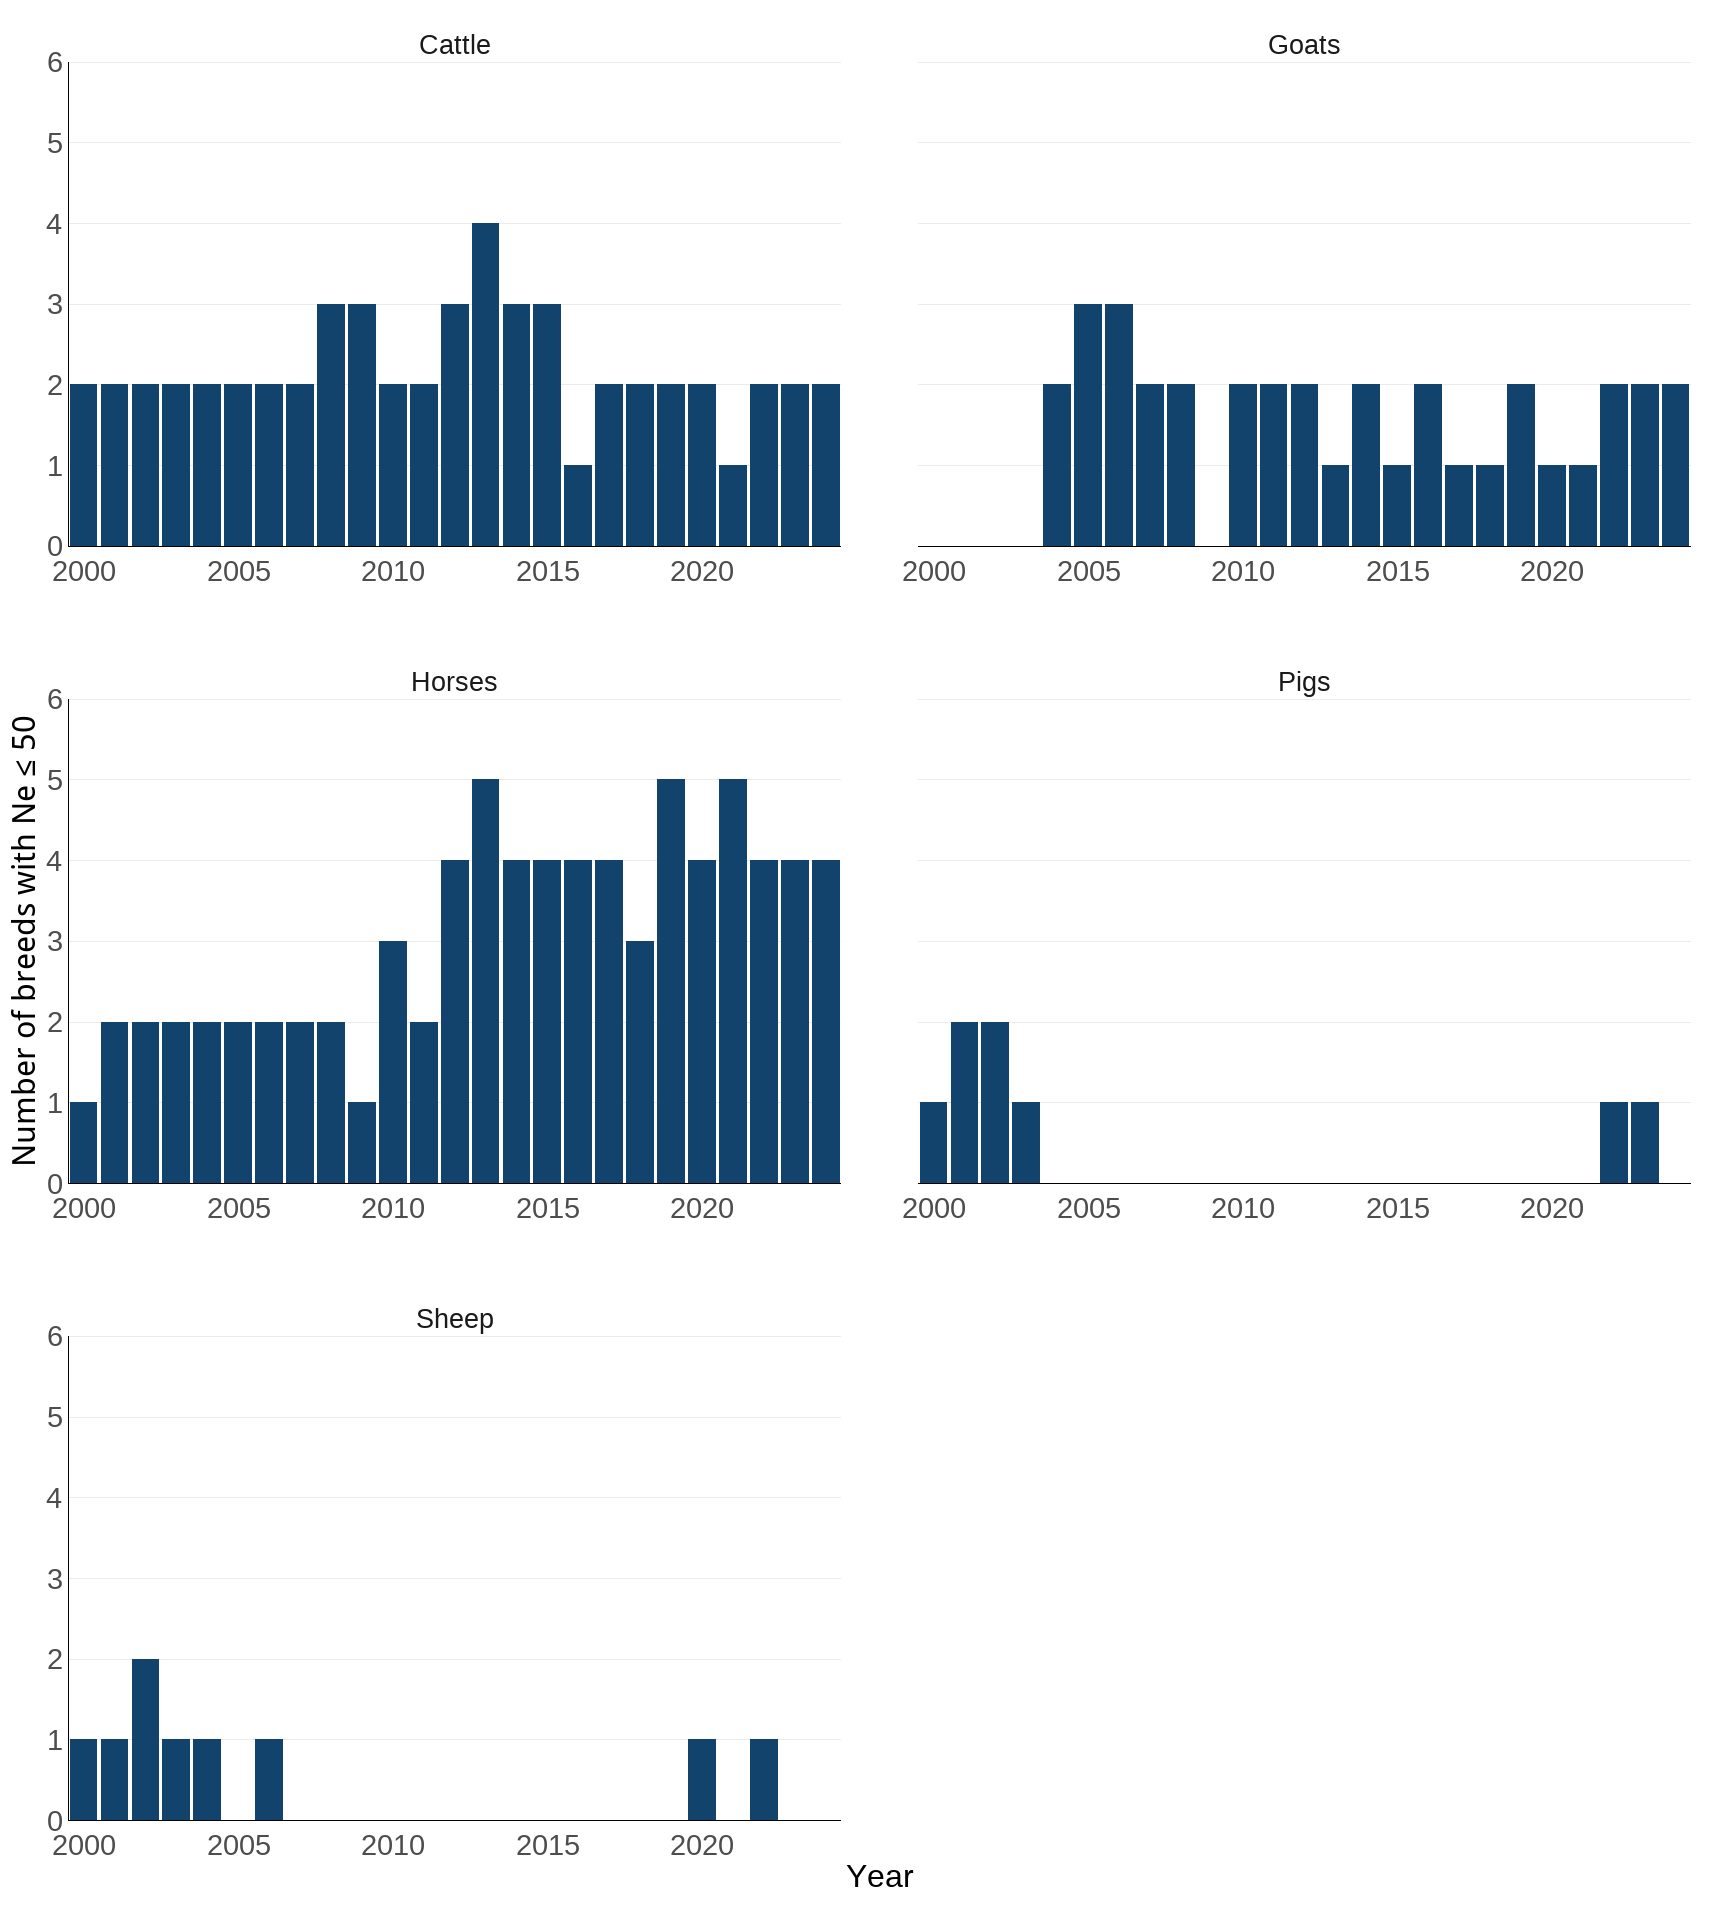
Source: British Pig Association; Defra; Grassroots Systems Ltd; Rare Breeds Survival Trust; and participating breed societies; as published on 15 May 2025 in the UK Farm Animal Genetic Resources Breed Inventory
Notes about Figure 2
- The indicator includes breeds that are classed as NBAR in the breed inventory published in 2025. Changes in NBAR status during the time series have not been factored into the selection of breeds that are included in each year.
Further detail
The UK Farm Animal Genetic Resources (FAnGR) Committee breed inventory was first published in 2014 with information for pigs, goats and horses, and was expanded in 2015 to include sheep and cattle.
In the inventory published in 2025 (with data up to 2024), all six native breeds of goats, all 11 native breeds of pigs, 14 of 19 native horse breeds, 41 of 55 native sheep breeds, and 21 of 30 native cattle breeds were classified as NBAR (for definitions of native breeds, and native breeds at risk, see Appendix 1 of the UK Country Report on Farm Animal Genetic Resources 2012).
For pigs, data to calculate effective population size is available for all years for all breeds included in the indicator (from 2000 to 2024 for 11 breeds). However, for goats, horses, sheep and cattle, the number of breeds contributing to the indicator generally increases over time as more data becomes available.
Table 1 provides information on the number of breeds in the indicator with an effective population size greater than zero published in 2025 (latest data 2024), and context of the total number classified as NBAR.
Table 1: The number of breeds contributing to the indicator in the latest year with data available
| Species | Number of breeds in the indicator | Total number of native breeds at risk | Percentage coverage by the indicator |
|---|---|---|---|
| All | 85 | 93 | 91 |
| Cattle | 19 | 21 | 90 |
| Goats | 6 | 6 | 100 |
| Horses | 14 | 14 | 100 |
| Pigs | 11 | 11 | 100 |
| Sheep | 35 | 41 | 85 |
Source: British Pig Association; Defra; Grassroots Systems Ltd; Rare Breeds Survival Trust; and participating breed societies; as published on 15 May 2025 in the UK Farm Animal Genetic Resources Breed Inventory
Table 2 provides information on the maximum number of breeds in the indicator over the complete data series, and context of the total number classified as NBAR.
Table 2: The maximum number of breeds contributing to the indicator
| Species | Maximum number of breeds in the indicator | Total number of native breeds at risk | Percentage coverage by the indicator |
|---|---|---|---|
| All | 85 | 95 | 89 |
| Cattle | 20 | 21 | 95 |
| Goats | 6 | 6 | 100 |
| Horses | 14 | 14 | 100 |
| Pigs | 11 | 11 | 100 |
| Sheep | 36 | 44 | 82 |
Source: British Pig Association; Defra; Grassroots Systems Ltd; Rare Breeds Survival Trust; and participating breed societies; as published on 15 May 2025 in the UK Farm Animal Genetic Resources Breed Inventory
The calculations in this indicator are for the breeds for which there are currently data; this is a subset of the native breeds at risk. Figure 3 shows the number of native breeds at risk for which it was possible to calculate effective population size in a year, and thus contribute to the indicator.
Figure 3: The number of NBAR breeds contributing to the indicator
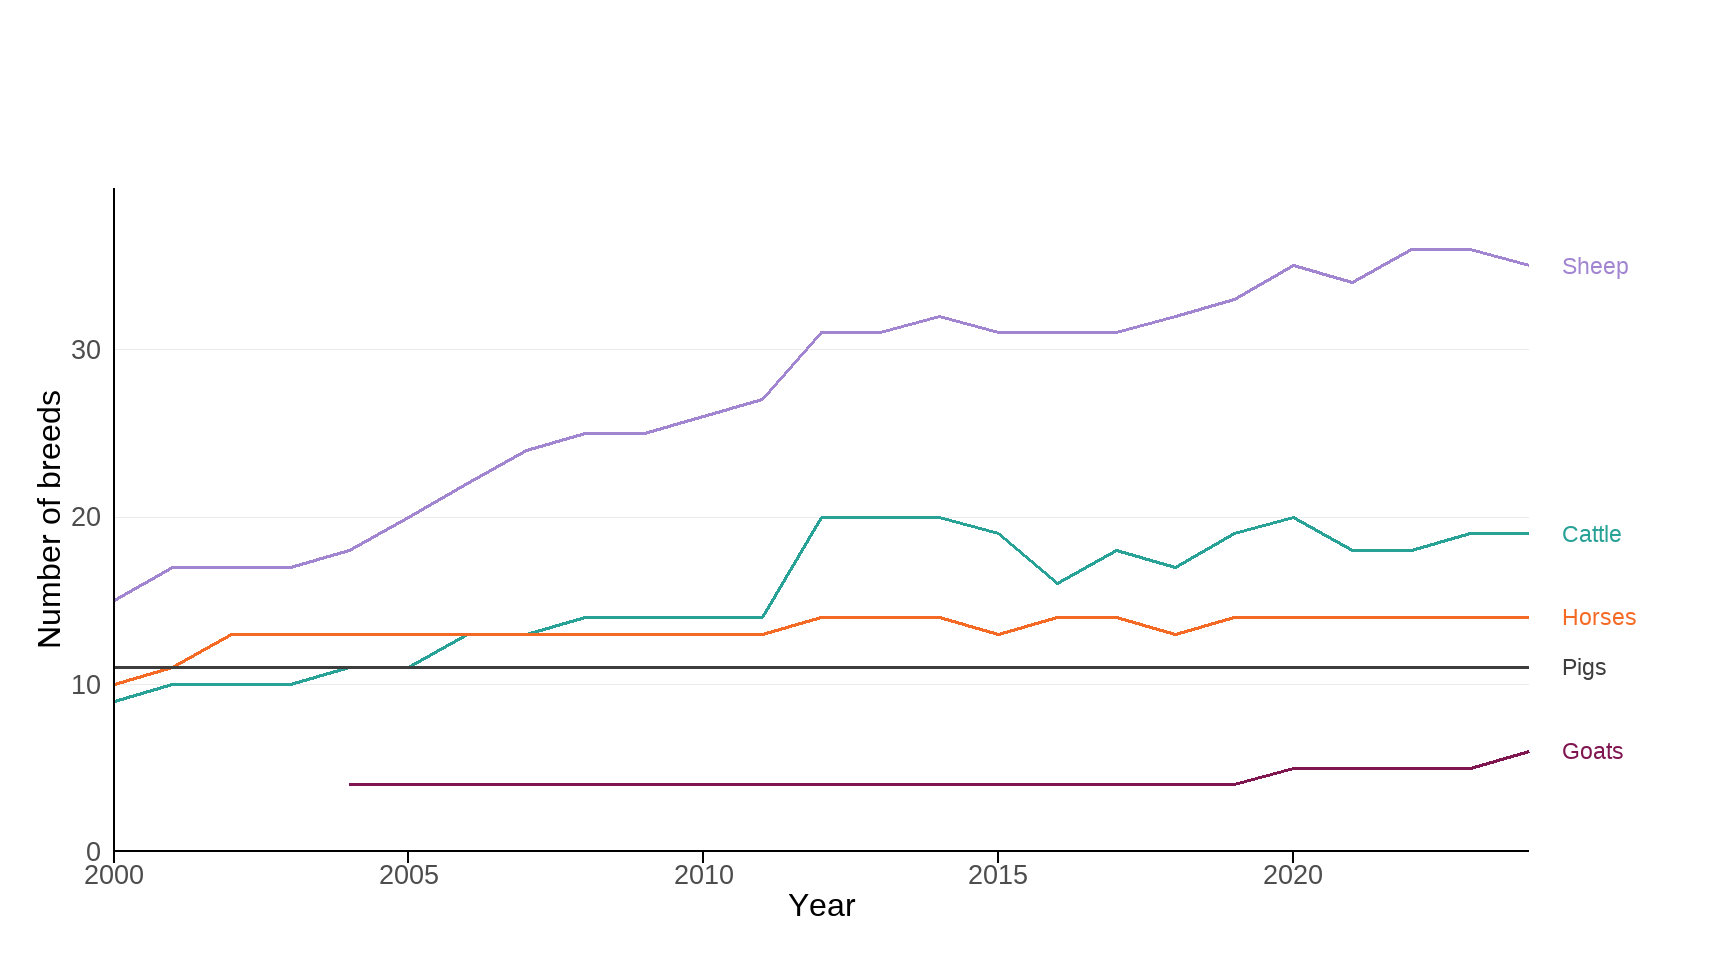
Source: British Pig Association; Defra; Grassroots Systems Ltd; Rare Breeds Survival Trust; and participating breed societies; as published on 15 May 2025 in the UK Farm Animal Genetic Resources Breed Inventory
Notes about Figure 3
- The indicator includes breeds that are classed as NBAR in the breed inventory published in 2025. Changes in NBAR status during the time series have not been factored into the selection of breeds that are included in each year.
There is an increase in the number of breeds in the indicator for 2012 to 2014 as a result of incorporating the data from the triennial data collection exercise that was formerly carried out. The datafile provides information on the number of breeds included in the indicator each year.
Relevance
Genetic diversity is an important component of biodiversity. The UK genetic diversity indicator focuses on the diversity of Native Breeds at Risk of a number of farm animal species (cattle, sheep, goats, horses and pigs). Genetic diversity in livestock breeds is important for a number of reasons. Aside from their cultural importance, local adaptation and links to breed-specific products, native or rare livestock breeds provide a resource from which to develop new breeds or improve existing breeds.
UK farm animal genetic resource is a key asset in economic, environmental, social and cultural terms. Native breeds of farm animals are often associated with traditional land management required to conserve important habitats. The indicator is also relevant to the commitments on conservation of native breeds in the UK National Action Plan on Farm Animal Genetic Resources.
International/domestic reporting
The suite of UK Biodiversity Indicators has been revised and updated to bring it in line with the Kunming-Montreal Global Biodiversity Framework (GBF) of the Convention on Biological Diversity (CBD). Some UKBIs will be used for the forthcoming UK national reports to CBD.
Web links for further information
- UK National Action Plan on Farm Animal Genetic Resources (2006) (PDF, 1.3Mb)
- Poultry in the UK (PDF, 3.5Mb)
- UK Country Report on Farm Animal Genetic Resources 2012
- UK Breeds at risk list
- UK Farm Animal Genetic Resources (FAnGR): breed inventory results
- Previous indicator, first published in 2009 Research Report: UK Biodiversity Indicators – development of an indicator of genetic diversity in selected farm breeds (WC0717); indicator fiche in The National Archives
- European Farm Animal Biodiversity Information System (EFABIS) – UK page. Note: Statistical data in the UK EFABIS database is automatically carried over to the clone database systems at the European level and global levels.
- Rare Breeds Survival Trust Watchlist
- Domestic Animal Diversity Information System (DAD-IS)
- Management of small populations at risk
Acknowledgements
Thank you to the many people who have contributed by providing data and to the many colleagues who have helped produce this indicator.
Technical annex
Methodology
As all pedigree animals need to be registered with their respective society to receive their pedigree certificate, the breed society records are comprehensive. Data in the inventory is sourced from individual breed society records and is drawn from two sources. To maximise efficiency in data collection, central database suppliers who maintain the breed society databases supply the data to the Defra Farm Animal Genetic Resources team. This is the main source of data used in the indicator and breed societies have given their permission for these companies to supply the data to Defra every year for this exercise.
Effective population size is a calculation which takes account of the total number of animals in a population and the relative number of sires and dams (male and female parents). A low effective population size signifies a greater likelihood of inbreeding and risk of loss of genetic diversity. A larger effective population size implies a lower risk of inbreeding and higher genetic diversity.
The indicator includes breeds that are classed as NBAR in the breed inventory published in 2025. Changes in NBAR status during the time series have not been factored into the selection of breeds that are included in each year. The number of breeds included in the indicator varies year by year as a result of data availability for both sires and dams (data for both are needed to calculate effective population size). The maximum number of breeds included in each measure is 36 for sheep, 20 for cattle, 11 for pigs, 14 for horses, six for goats, and 85 for all species in the indicator. The annual data collection for the 2024 data covers six goat breeds, 11 pig breeds, 14 horse breeds, 35 sheep breeds, and 19 cattle breeds. More information about how many breeds are included in each year can be found in the Further detail section and the datafile.
Over the course of time, data for some breeds has been revised. Therefore, this indicator is not directly comparable with previous publications. The Breed Inventory publication provides information on revisions.
Calculating average effective population size
The indicator was calculated in three steps:
- The effective population size (Ne) for each breed in the inventory has been calculated using Sewell Wright’s formula:
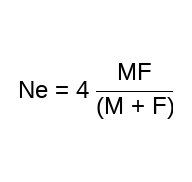
where M = number of sires and F = number of dams
- Data for breeds flagged as Native Breeds at Risk (NBAR) were selected; and
- The geometric mean of the Ne for NBAR breeds within a species was calculated.
Data for each breed within a species have been combined using a geometric mean rather than an arithmetic mean, as this reduces the influence of very common or very rare breeds on the overall number calculated. This technique is used for a number of other UK Biodiversity Indicators – such as for birds, bats and butterflies.
Wright’s formula makes a number of assumptions; it usually produces an estimate of Ne that is higher than would be produced by a calculation using breed by breed pedigree information. However, such information is not readily available, and the indicator could not be calculated if it relied on such a methodology. Wright’s formula has the advantage of being simple to calculate, and importantly, can be applied to the data available.
For many other UK Biodiversity Indicators, the variability in the data is presented through confidence intervals, and the number of species increasing or decreasing within the trend lines shown. Given that it is necessary to register offspring as pedigree before they can themselves be used to produce pedigree offspring, the data in the inventory are census data rather than sample data, and therefore confidence intervals are not necessary. In bringing the data together as an average, that is itself the only value that can be calculated, so unlike most averages which are based on sampling data, it is not appropriate to calculate confidence intervals.
It is noted that there may be a delay in registering pedigree offspring, such that the data for a year in the inventory may actually partly represent individuals born in the previous year.
Assessment of change
The assessment of change for the indicator was made by applying a 5% rule of thumb. 5% was chosen to recognise the human element in the choice of which sires breed with which dams (which is not random for non-feral breeds), and because this level has already been chosen by the Rare Breeds Survival Trust to identify changes from the previous year’s Watchlist publication. The arithmetic mean of the first three years of the data series for each species was compared with the most recent value (2024), to determine the assessment for the long-term trend. An arithmetic mean of the year five years prior in the time-series and the year either side of this (2018 , 2019 , 2020) was calculated to compare with the most recent value (2024) to assess the short-term trend. It should be noted that single year variations in the measures are not hugely meaningful, due to the human element in which sires breed with which dams.
Background
Simply defined, a breed can be taken to mean a specific group of animals that, through selection and breeding, have similar characteristics (including, for example, appearance and behaviour) that are passed on to their offspring and which distinguish them from other animals of the same species. However, worldwide use of the term ‘breed’ and the various breed categories (for example ‘autochthonous’, ‘native’, ‘indigenous’, ‘heritage’, ‘patrimonial’, ‘naturalised’, or ‘locally adapted’) does not guarantee that these terms are defined in the same way. The UK has adopted some of these terms; definitions are provided in Appendix 1 of the 2012 UK Country Report on Farm Animal Genetic Resources.
The UK is home to some of the richest and most diverse farm animal genetic resources in the world, with approximately 700 breeds including cattle, sheep, goats, pigs, horses and ponies and poultry; the UK contains more than 9% of the total of global livestock breeds. There are some 200 native breeds according to the definition adopted by the UK Farm Animal Genetic Resources Committee, the majority of which are considered to be “at risk”. A list of known breeds in the UK is given in Appendix 2 of the 2012 UK Country Report on Farm Animal Genetic Resources and in the Annex of the 2010 Poultry in the UK report. Defra and its FAnGR Committee monitor the status of UK breeds to determine if they are native, exotic, at risk or not; and ensure that eligible species/breeds:
- Are offered potential protection in an outbreak of an exotic disease (as far as possible within the constraints of controlling the disease).
- Have potential access to a grazing supplement under agri-environment schemes.
Many of the UK’s habitats that are now valued for their biodiversity were created by, or for, farm animals. These habitats include various types of upland and lowland grasslands and heathlands, hay meadows and pasture-woodlands. Other habitats, such as sand dunes, salt marshes and even woodlands may also benefit from light grazing. If these habitats are not grazed they may lose their special conservation value as they become invaded and eventually dominated by scrub and trees through the process of ecological succession.
Although it is not possible to measure the genetic variation in all traits of interest, the average rate of loss in genetic variation can be estimated, since this rate can be described by calculating the ‘effective population size’.
The UK Farm Animal Genetic Resources Breed Inventory is an electronic monitoring system. It was first published by Defra in July 2014 and updated annually since then. The monitoring system contains data on the status and trends in the domestic pig, goat, horse, sheep and cattle farm animal genetic resources with continuous data from 2000 to 2024 for up to around 100 NBAR breeds which are present in the UK. More recently, the electronic monitoring system for FAnGR is collecting more information and more regularly, which is leading to greater completeness of data.
Defra and the Farm Animal Genetic Resources Committee will continue to monitor populations of UK livestock breeds regularly; the list of breeds considered to be at risk is kept under annual review using the monitoring data collected, with breeds at risk potentially eligible for protection in an outbreak of an exotic disease (within the constraints of controlling the disease).
Supplementary information from the Rare Breeds Survival Trust Watchlist
The Rare Breeds Survival Trust (RBST) works to conserve and protect the United Kingdom’s rare native breeds of farm animals from extinction as a resource for future generations and for the benefit of agriculture. Between 1900 and 1973, the United Kingdom lost 26 of its native breeds. This was caused by changing farming methods and a much more intensive approach to food production. Since the formation of the Trust in 1973 no other native livestock breed has become extinct in the UK.
The RBST publishes an annual watchlist, which highlights changes in breed population trends. The 2021-22 Watchlist was compiled using a new methodology, based on effective population size (previously the number of registered females was used) and taking into account the degree of inbreeding. Thus this approach is now more comparable to that used in this indicator. The Watchlist now categorises ‘Priority’ and ‘At Risk’ breeds for sheep, cattle, equine, pigs, goats and poultry, as well as listing ‘Other Native Breeds’ and ‘Irish Breeds in the UK’.
Within the Priority and At Risk categories, the 2024-25 Watchlist includes 28 breeds of sheep, 14 cattle, 11 pigs, four goats and 13 horse breeds.
Development plan
Since our previous publication we have adapted the language and visualisations used in this indicator. We are keen to hear from our users about these changes, as well as our published development plan, please email us.
Categories:
Published: